Trends in GDP Growth and its Driving Factors
Teodora Borota Milicevic
Bilaga 1 till Långtidsutredningen 2023
Stockholm 2023
SOU 2023:86
SOU och Ds finns på regeringen.se under Rättsliga dokument.
Svara på remiss – hur och varför
Statsrådsberedningen, SB PM 2021:1.
Information för dem som ska svara på remiss finns tillgänglig på regeringen.se/remisser.
Layout: Långtidsutredningen 2023, Regeringskansliet
Omslag: Elanders Sverige AB
Tryck och remisshantering: Elanders Sverige AB, Stockholm 2023
ISBN
ISBN
ISSN
Förord
Långtidsutredningen 2023 har utarbetats av ett fristående projektgrupp inom Finansdepartementets enhet för ekonomisk politik och fördelning. Inom ramen för utredningen har ett antal specialstudier tagits fram, vilka publiceras som fristående bilagor. Av huvudbetänkandet framgår hur bilagornas analyser och slutsatser använts i utredningens arbete.
Denna bilaga har utarbetats av Teodora Borota Milicevic, universitetslektor vid Uppsala universitet. De åsikter om uttrycks i denna bilaga är författarens egna.
Arbetet med bilagan har följts av en referensgrupp bestående av Lars Calmfors, Peter Englund (t.o.m. april 2023), Urban Hansson Brusewitz, Johannes Lindvall, Johan Lyhagen, Marcus Mossfeldt, Hovick Shahnazarian och Karl Walentin.
Thomas Eisensee, Harry Flam, Nils Gottfries, Anna Seim, Lars E.O. Svensson och Hanna Ågren har gett värdefulla bidrag som kommentatorer.
Ett särskilt tack riktas till
Bilagans författare vill tacka Nils Gottfries för värdefulla synpunkter.
Stockholm december 2023
| Marcus Mossfeldt | Hovick Shahnazarian |
Projektledare, Långtidsutredningen
Table of Contents
5
| Table of Contents | SOU Bilaga 1 till LU2023 |
4.2.1Lasting scarring effects and benefits of the big
| crises......................................................................... | 65 |
4.3Greening of the economy – important factors in future
6
Summary
The last four decades have seen weaker economic performance in many advanced economies, with Gross Domestic Product (GDP) growth rates following a downward path since the late 1990s. The growth rates have reached levels up to 1.5 percentage points lower than in the 1980s. In Sweden, on the other hand, the growth rate was strong in the late 1990s and early 2000s but has also deteriorated and returned to slightly lower levels compared to the early 1980s. Economic analysis of this
This report explores the potential GDP's mediumand
7
| Summary | Bilaga 1 till LU2023 |
In many advanced economies, the trend in the prospective
The primary factor influencing
8
| Bilaga 1 till LU2023 | Summary |
Total factor productivity (TFP), as the ratio of an economy's output to its total inputs, has been the key contributor to labor productivity and total output growth since World War II. The decline in TFP growth, on average, has been widespread across the developed world. Some research suggests that the decline is due to diminishing productivity benefits of new technologies, while others suggest failures of innovation policies and weak investment. Swedish experience resembled those of the US and UK, with the strongest growth occurring in the ICT sector. The financial crisis and Great Recession had further negative implications on TFP growth, with a strong initial contraction but also the recovery after 2010.
Looking ahead, forecasting potential output and growth in the near and long run is challenging due to the prolonged economic implications of the
9
| Summary | Bilaga 1 till LU2023 |
potential positive developments. Labor productivity growth is projected to rise from less than 1 to 1.5 percent by 2030 and remain stable throughout the period. TFP growth, labeled as the sole source of potential output growth in the EU Commission forecasts, will be recovering but only up to
Finally, a crucial policy issue - climate change mitigation and greening of the economy – is in the focus of many debates. To achieve net carbon neutrality by 2050, world economies must implement large and rapid policy interventions, including greenhouse gas (GHG) emission taxes, emission trading systems, government regulation of emissions, and investment in
10
| Bilaga 1 till LU2023 | Summary |
about negative pressures on potential GDP growth due to the reallocation of investments to climate adaptation purposes.
11
Sammanfattning
Under de senaste fyra decennierna har många avancerade ekonomier haft svaga ekonomiska resultat, där bruttonationalproduktens (BNP) tillväxttakt följer en nedåtgående trend sedan slutet av 1990- talet. Tillväxttakten har legat på nivåer upp till 1,5 procentenheter lägre än på
I denna bilaga undersöks den potentiella utvecklingen av BNP på medellång och lång sikt för Sverige och andra jämförbara länder. Trenden i potentiell produktion analyseras genom dess två huvudkomponenter, trenden i arbetade timmar och arbetsproduktivitet,
13
| Sammanfattning | Bilaga 1 till LU2023 |
där den senare drivs av förändringarna i kapital per enhet arbete, humankapital och total faktor produktivitet (TFP).
I många avancerade ekonomier har trenden i den framtida arbetsåldern
Den primära faktorn som påverkar det långsiktiga ekonomiska välbefinnandet är arbetsproduktiviteten, vilken har förmågan att kompensera för negativa förändringar i andra strukturella faktorer. En betydande nedgång i dess tillväxt under de senaste decennierna har varit den mest anmärkningsvärda faktorn bakom den ekonomiska utvecklingen. Med undantag för korta intervaller med högre resultat, som i USA och Sverige i slutet av
– kapital per enhet arbete och total faktorproduktivitet (TFP) – sticker ut. I Sverige började nedgången i kapitalbildning och fördjupning (tillväxt i kapitalbeståndet per enhet arbete) på
14
| Bilaga 1 till LU2023 | Sammanfattning |
många avancerade ekonomier har ackumuleringen av immateriellt kapital accelererat och överstigit materiella investeringar. Sverige har sedan mitten av
Total faktorproduktivitet (TFP), förhållandet mellan ekonomins produktion och dess totala insatser, har varit den viktigaste bidragande faktorn till arbetsproduktivitet och total produktionstillväxt sedan andra världskriget.
Framtida prognoser om potentiell produktion och tillväxt på kort och lång sikt är utmanande på grund av de långvariga ekonomiska konsekvenserna av
15
| Sammanfattning | Bilaga 1 till LU2023 |
nomier, om än något senare och på något högre nivåer. En positiv effekt som
Slutligen är en avgörande politisk fråga – begränsning av klimatförändringarna och greening of the economy - i fokus för många debatter. För att uppnå netto koldioxidneutralitet till 2050 måste världsekonomierna genomföra stora och snabba politiska åtgärder, inklusive växthusgasutsläppsskatter, system för handel med utsläpp, regeringsreglering av utsläpp och investeringar i koldioxidsnåla tekniker. IMF World Outlook 2020 rapporterar måttliga kostnader för optimala policypaket, som förväntas ha en nettopositiv effekt på den globala
16
| Bilaga 1 till LU2023 | Sammanfattning |
förhindras samtidigt som
17
1 Introduction
Potential output or potential gross domestic product (GDP) is a measure of the production capacity of an economy, a level of output that the economy can sustain given its available resources, implemented technology and the full efficiency at which those can be combined. As such, it is one of the central concerns of economic policy. Over a longer term, potential GDP, particularly in its per capita level, presents the main measure of (material) welfare level of a society, correlating positively to almost all measures of its living standards. Furthermore, potential GDP is the main reference for assessing the trend
This report discusses the
Section 2 presents the actual GDP developments since the 1980s in several advanced economies and in Sweden, analyses the main contributing factors of growth, focusing on the GDP growth slowdown observed across the economies. Understanding GDP growth as a
19
| Introduction | Bilaga 1 till LU2023 |
from the actual unemployment. Section 3.3.1 presents the definition and development of potential hours worked in the selected advanced economies. Moving forward, Section 4 presents the forecasts on future potential GDP and its growth, relying on the OECD, The EU Commission and the NIER analyses. Section 5 provides a final discussion on the key findings of the report and points to several important factors and policy challenges for the future. In particular, climate policy issues, globalization trends and the potential output measurement challenges are addressed.
20
2Gross Domestic Product (GDP) growth since the 1980s
2.1GDP growth slowdown
Following the
These developments have long been in the focus of the economic analysis, searching for the sources of the weaker growth performance among the structural components of GDP, permanent and
1The selected group of analyzed countries include advanced EU economies, France and Germany, Denmark as a Scandinavian economy, UK and the USA.
2Growth slowdown is even more significant if the latest decade’s observed rates are compared to the decades prior to 80’s which points to a
21
Gross Domestic Product (GDP) growth since the 1980sBilaga 1 till LU2023
| Figure 2.1 | Trend GDP growth since 1980 (in percentage), selected | |
| countries | ||
| 4 | ||
| 3,5 | Denmark | Germany |
| 3 | France | Sweden |
| 2,5 | UK | USA |
2
1,5
1
0,5
0
| 1980 | 1985 | 1990 | 1995 | 2000 | 2005 | 2010 | 2015 | 2020 | 2024 |
Note: The presented trend is calculated by applying the Hodrick
Source: OECD Economic Outlook Database (112) and own calculations.
2.2Reasons for the decline
Relying on the definition of the trend output growth as a purely
22
| Bilaga 1 till LU2023 | Gross Domestic Product (GDP) growth since the 1980s |
Sections
Figure 2.2 Illustration of GDP Components
| Technology | |||||||||
| Total Factor | |||||||||
| Productivity | |||||||||
| Efficiency | |||||||||
| Education | |||||||||
| Human capital | |||||||||
| Labor | |||||||||
| productivity | Training and | ||||||||
| experience | |||||||||
| Capital (physical | New capital | ||||||||
| acummulation | |||||||||
| and knowledge- | |||||||||
| GDP | based) per unit of | ||||||||
| Depreciation | |||||||||
| labor | |||||||||
Employment
population
Hours worked
worked
2.2.1Hours worked
Recent demographic developments with a marked slowdown in population growth (and population ageing affecting the share of dependent population and GDP per capita) have had a significant draw on the hours worked growth in many advanced countries (e.g. US and France) These changes have been compensated to a larger or smaller degree by stronger participation in the labor force and higher employment rates across countries. In some other economies, such as Sweden and Denmark, the negative demographic changes have not been experienced, partly due to strong fertility and immigration. Overall, with a notable exception of the US, the growth in hours worked have been relatively stable, or even remarkably stronger as in Sweden, in the analyzed period (see Figure 2.3), which shifts the
23
| Gross Domestic Product (GDP) growth since the 1980s | Bilaga 1 till LU2023 |
focus on labor productivity as the potential source of the observed GDP developments.
Figure 2.3 Trend growth in total hours worked (in percentage)
2
1,5
1
0,5
0
| 1981 | 1985 | 1990 | 1995 | 2000 | 2005 | 2010 | 2015 | 2020 |
DenmarkGermany
| France | Sweden | |||
UKUSA
Note: The presented trend is calculated by applying the Hodrick
Source: OECD Economic Outlook Database (112) and own calculations.
2.2.2Labor productivity
GDP per hour worked is the main driver of the long run development in economic welfare of population, with the capacity to compensate for the negative developments of other structural factors that lie largely outside the scope of economic policy, such as demographics. The most striking feature of economic developments in the past four decades (and longer) has been a significant downturn in the trend labor productivity growth. As shown in Figure 2.4, this slump has been experienced across all advanced economies, only with the exception of limited periods of stronger performance such as those in the US and Sweden in the end of ‘90s and beginning of 2000s. In this period, the Swedish economy caught up with the US, overpassing other advanced European economies, and in the two subsequent decades the developments in Swedish growth mimic the general trends. There is still an ongoing discussion in the economic
24
| Bilaga 1 till LU2023 | Gross Domestic Product (GDP) growth since the 1980s |
literature and debates on the potential reasons for the “productivity slump”, among other the nature and implementation process of the new (ICT) technologies. Up until the Great Recession, the trend in productivity was expected to recover as the new digital economy finally transformed the ways businesses operate and use their inputs. This development was awaited as productivity growth is typically expected to play the largest role in output growth over the projections and beyond.3
Figure 2.4 Trend growth in labor productivity (in percentage)
4
DenmarkGermany
3,5
| France | Sweden | |
| 3 | UK | USA |
2,5
2
1,5
1
0,5
0
| 1980 | 1985 | 1990 | 1995 | 2000 | 2005 | 2010 | 2015 | 2020 |
Note: The presented trend is calculated by applying the Hodrick
Source: OECD Economic Outlook Database (112) and own calculations.
As the most important driver of the developments in the trend GDP level and growth rate, labor productivity is also the biggest contributor to the actual GDP level and growth as well as to their developments over time. (see Figure 2.5).
3There is, however, an ongoing debate about exactly how much one can expect productivity growth to rise (Schembri 2018).
25
| Gross Domestic Product (GDP) growth since the 1980s | Bilaga 1 till LU2023 |
Figure 2.5 Decomposition of GDP growth rate in Sweden, hours worked growth and labor productivity growth (in percentage)
| 8 | 8 | |||||||||||||||||||||||||||||||||||||||||||||||||||||||||||||||||||||||||||||||||
| 6 | Total hours worked | Labor Productivity | GDP Growth | 6 | ||||||||||||||||||||||||||||||||||||||||||||||||||||||||||||||||||||||||||||||
| 4 | 4 | |||||||||||||||||||||||||||||||||||||||||||||||||||||||||||||||||||||||||||||||||
| 2 | 2 | |||||||||||||||||||||||||||||||||||||||||||||||||||||||||||||||||||||||||||||||||
| 0 | 0 | |||||||||||||||||||||||||||||||||||||||||||||||||||||||||||||||||||||||||||||||||
| 1985 1987 1989 1991 | 1993 1995 1997 1999 2001 | 2003 2005 2007 2009 2011 2013 2015 2017 2019 | 2021 | |||||||||||||||||||||||||||||||||||||||||||||||||||||||||||||||||||||||||||||||
Source: OECD Economic Outlook Database (112).
Human Capital
Labor input, measured by the employment and average hours worked, accounts only for the volume of this factor of production. The quality of labor factor, labeled as human capital, includes labor knowledge, skills and its ability, affecting the efficiency of physical (and other forms of) capital utilization, and is thus partly determining the productivity growth. The evolution of labor input quality and changes in labor composition have historically been some of the key growth promoting factors, alongside the TFP growth.
As it is embodied in the labor itself, human capital is very hard to measure. It is typically determined by the level of education and training and experience workers obtain during their working life, on average. In practice, most often it is represented simply by the average years of schooling or completion rates by education level. Educational attainment measured by the average years of schooling has been on a steady rise since 1980 in most of the world economies, including Sweden (see Figure 2.6). Right panel reveals the sources of the average years of schooling increase in Sweden. While the initial
26
| Bilaga 1 till LU2023 | Gross Domestic Product (GDP) growth since the 1980s |
improvements occurred due to a rise in both the shares of population with secondary and tertiary education until early 2000s, the subsequent developments have been entirely driven by the rise in the highest education group shares, once the only primary education group share has reached low levels.4 This points to the fact that the Swedish education attainment is well in a phase where college education becomes the norm for the labor market.
Figure 2.6 Education as a measure of human capital: average years of schooling (left panel) and the population shares by education level in Sweden (right panel)
| 14 | 80 | |
| 13 | % of population in Sweden | ||||||||||||||
| 70 | |||||||||||||||
| 12 | |||||||||||||||
| 60 | |||||||||||||||
| 11 | Primary | ||||||||||||||
| 10 | 50 | Secondary | |||||||||||||
| 9 | Denmark | 40 | Tertiary | ||||||||||||
| Germany | |||||||||||||||
| 8 | France | ||||||||||||||
| Sweden | 30 | ||||||||||||||
| 7 | UK | ||||||||||||||
| USA | |||||||||||||||
| 20 | |||||||||||||||
| 6 | |||||||||||||||
| 5 | 10 | ||||||||||||||
| 4 | 0 | ||||||||||||||
| 1980 | 1985 | 1990 | 1995 | 2000 | 2005 | 2010 | 2015 | 1980 | 1985 | 1990 | 1995 | 2000 | 2005 | 2010 | 2015 |
Source:
It should be noted that the human capital level is not a uniform measure across the labor force as represented by the average years of schooling. Workers differ in their education level, quality of education, skills and abilities, and thus their contribution to productivity, which may also be changing over time5. Differences in productivity contributions are normally captured in wages which are in turn used for the calculation of weighted or quality adjusted labor
4Nevertheless, a persistent problem in the labor market is a high level of unemployment among the
5For example, fast technological progress introducing new ways of working may renders certain forms of education and training obsolete over time. Age, on the other hand, affects human capital through the tradeoffs between a higher work experience (older workers) and a more recent,
27
| Gross Domestic Product (GDP) growth since the 1980s | Bilaga 1 till LU2023 |
services6, but a special attention should be given to potential discriminatory wage penalties, which among other issues render the wage a poor proxy of productivity. (NIER 2008) Finally, common measures of human capital do not fully capture the value of productive services of this type of capital. Labor skills and abilities are only contributing to output if they are properly matched with the productive requirements of the jobs where labor is employed, an aspect which becomes increasingly important in the times of rapid technological and structural changes. Persistent misalignment between the demand and supply of skill at the aggregate and micro level leads to lower labor productivity reflected in workers compensations. OECD (2016b) review on the Swedish labor force skills development and allocation reveals that while 33 percent of firms report difficulties in hiring due to a lack of appropriate skills, around 34 percent of workers experience field of study mismatch, 39 percent are mismatched by qualifications (either higher or lower) and around 11 percent are mismatched by skills.
Physical and
Growth in capital intensity, i.e. the capital per unit of labor input (per hour worked, or per worker), is another factor of crucial contribution to the labor productivity growth. Total capital stock grows due to continuous investments, corrected for the depreciation and scrapping of the obsolete capital. In its intensive form, it measures how
6The OECD Measuring Productivity Manual (OECD, 2001) lays out an approach to account for the heterogenous human capital where workers are grouped by their marginal productivities proxied by different characteristics (age, education, occupation, sex). Each group’s contribution to economic growth is then calculated through the contribution of the growth rate in the group’s hours worked weighted by its share in total income accruing to the labor factor. Using this approach, a study based on labor data from a subset of the OECD economies finds that the labor quality composition accounted for 20 percent of labor productivity growth in the
28
| Bilaga 1 till LU2023 | Gross Domestic Product (GDP) growth since the 1980s |
growth and capital accumulation. A lower growth in labor force implies a lower need for investment in order to keep the
However, capital deepening has showed similar negative developments over the last four decades, with a higher or lower trend over periods depending on the labor input growth. On average, capital deepening rates have ended up at levels
7Arguably, these links between capital accumulation and population and employment trends have greatly affected the prevailing real interest rates in the global economy.
8A decade after the wake of the financial crisis of 2007, OECD countries on average experienced a 0.4 percentage point drop in the annual capital deepening rate and can account for the slowdown in trend productivity growth in the
29
Gross Domestic Product (GDP) growth since the 1980sBilaga 1 till LU2023
| Figure 2.7 | Capital deepening (trend), total for selected countries and by | ||
| capital type in Sweden | |||
| 6 | 25 | ||
| Denmark | |||
| Germany | Sweden | ||
| 5 | |||
| France | 20 | Total | |
| Sweden | capital | ||
| UK | ICT | ||
| 4 | USA | capital | |
| 15 | |||
| capital | |||
| 3 | |||
| 10 | |||
| 2 | |||
| 1 | 5 | ||
| 0 | 0 | ||
| 1985 1989 1993 1997 2001 2005 2009 2013 2017 2021 | 1985 1989 1993 1997 2001 2005 2009 2013 2017 2021 | ||
Note: The presented trend is calculated by applying the
Source: OECD Economic Outlook Database (112) and own calculations.
Disaggregating the total capital into Information and Communication Technologies (ICT) capital and
A bulk of studies that aim to quantify the importance of different contributors to output growth has failed to account properly for the category of
9
30
| Bilaga 1 till LU2023 | Gross Domestic Product (GDP) growth since the 1980s |
There are many forms of capital used in the production processes. The most traditional notion of physical capital in its intensive form, indicates how much of the physical capital (machines, equipment, buildings, infrastructure) is used by a worker, and it is a product of the installed capital capacity and the measure of the intensity of its usage. This traditional view differs from the way we think about the new forms of capital in modern economies. The new form of
aproduct of firms’ investment in
KBC is intangible in its nature and, historically, the national accounts analysis and empirical studies have had difficulties in measuring KBC and accounting for several of its forms, e.g. firmspecific training, design, innovative property and organizational quality. Recent two decades have seen substantial advances on this front, most notably the introduction of the expenditure-
10Corrado et al. (2009) find that the intangible investment in the U.S. started to grow faster than tangible investment in the 1970s and accounting for these trends, the contribution of TFP growth to labor productivity growth has been revised downwards, from 35 percent to
25percent in the
31
| Gross Domestic Product (GDP) growth since the 1980s | Bilaga 1 till LU2023 |
based treatment of KBC (an investment instead of intermediate consumption) which has spurred growth accounting studies estimating the KBC investment contribution to economic growth, but there are still outstanding issues particularly regarding consistency and comparability across countries. An important conclusion is that different kinds of capital have different productivities. In order to properly account for those in a growth accounting exercise, one is advised to consider different forms of capital separately.11
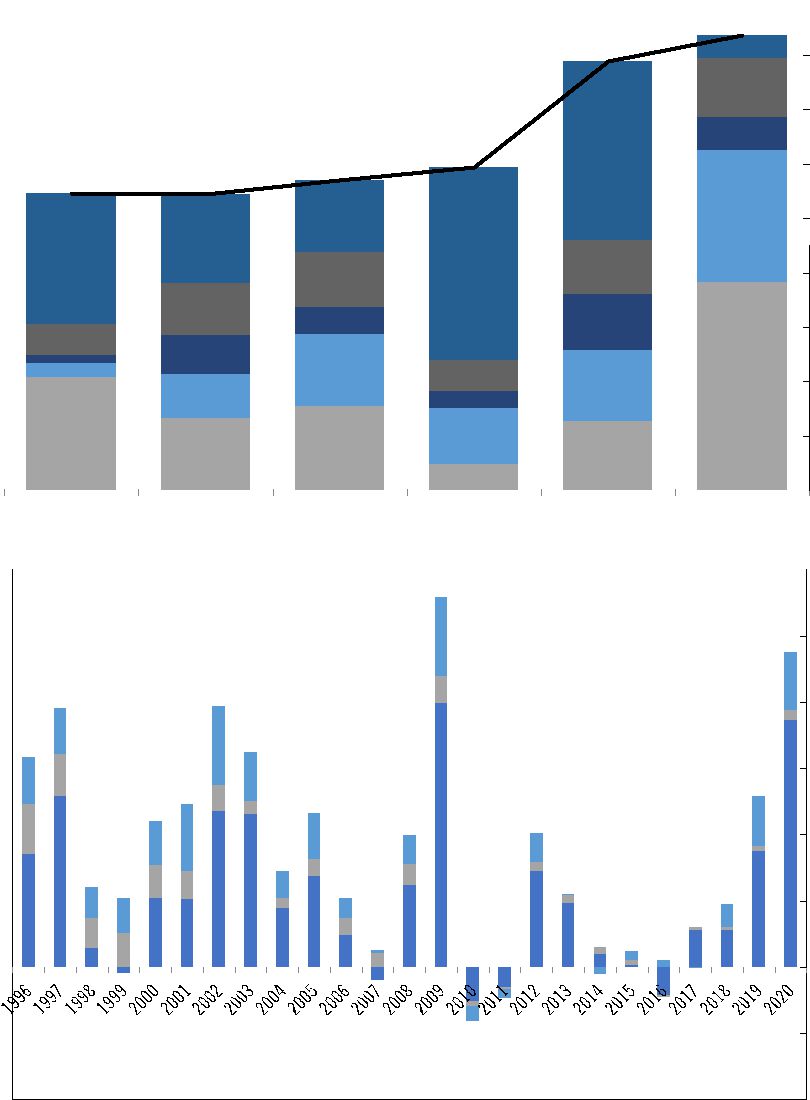
Figure 2.8 presents the contribution of different categories of capital deepening to labor productivity growth. Sweden has proved to be among the countries with substantial contribution of intangible and
11Analysts typically distinguish between several different forms of capital: tangible
32
| Bilaga 1 till LU2023 | Gross Domestic Product (GDP) growth since the 1980s |
Figure 2.8 Contribution of different types of capital deepening to Labor productivity growth: intangible vs. tangible assets
| 1,8 | ||||||||||||||
| Labor composition | Tangible |
1,6 | ||||||||||||
| Tangible ICT | Intangible | 1,4 | ||||||||||||
| TFP | Labor Productivity | |||||||||||||
| 1,2 | ||||||||||||||
| 1 | ||||||||||||||
| 0,8 | ||||||||||||||
| 0,6 | ||||||||||||||
| 0,4 | ||||||||||||||
| 0,2 | ||||||||||||||
| 0 | ||||||||||||||
| France | United Kingdom | Denmark | Germany | United States | Sweden | |||||||||
| 3 | ||||||||||||||
| Tangible |
||||||||||||||
| 2,5 | ||||||||||||||
| Tangible ICT | ||||||||||||||
| 2 | ||||||||||||||
| Intangible | ||||||||||||||
| 1,5 | ||||||||||||||
| 1 | ||||||||||||||
| 0,5 | ||||||||||||||
| 0 | ||||||||||||||
Source: EUKlems & INTANProd Database, 2023.
Total Factor Productivity (TFP)
Total factor productivity (TFP) is the ratio of the measure of output in an economy and the measure of total inputs used (labor and
33
| Gross Domestic Product (GDP) growth since the 1980s | Bilaga 1 till LU2023 |
different types of capital), combined according to the production function. TFP growth is thus a difference between the growth rate of total output and the weighted growth rates of inputs. In other words, growth in TFP measures all the changes in output that cannot be attributed directly to the changes in the quantity of labor and capital inputs generating that output. Therefore, assessing the contribution of the total factor productivity (TFP) trend growth depends crucially on the ability to properly quantify the contributions of other factors, as the TFP growth is in turn treated as the residual development. Using modern techniques and considering all the possible types of assets with increasingly important shares in the economy, the TFP growth contribution still stays firmly in the first place of important contributors to labor productivity and total output growth. Trends in the TFP have indeed been driving labor productivity in the advanced economies since the World War II. This empirical finding goes in line with the predictions with almost all of the existing growth models.12
Components and drivers of TFP growth
The main component of the TFP growth is technological change (see e.g. Basu and Fernald (2002) for evidence). This is not to say that TFP growth does not change for reasons different than improvements in technology; institutional change, market deregulation and removal of distortionary tax systems can serve as examples of efficiency changes affecting trend TFP growth. However, many of the central efficiency improvement policies and regulations have already been implemented in the advanced economies which probably leaves the technological progress as the main contributor to TFP growth. Some growth studies add the “scale change” component to the classification of TFP growth components – a factor conditional on recognizing potential deviations from constant returns to scale technology which allows for productivity benefits that rise or fall with the scale of production.
A notable efficiency channel affecting TFP growth operates through reallocation of resources within and across firms and
12For a comprehensive review on the traditional and modern growth theory, see Appendix A.
34
| Bilaga 1 till LU2023 | Gross Domestic Product (GDP) growth since the 1980s |
industries, driven by exposure to competition in domestic and foreign markets. The Swedish economy, as a small open economy with a large share of firms involved in international trade and competition in global markets, has experienced significant changes and potentially large associated efficiency benefits from globalization. (Jakobsson 2007)
The OECD report “The Future of Productivity” (OECD, 2015) offers a structured analysis of the TFP growth drivers and identifies the three main categories:
•Factors that incentivize innovation – research and development (R&D), digitalization and investment in intangible capital;
•Factors driving knowledge and technologies diffusion – labor skills and qualifications, and public infrastructure; and
•Factors and institutions that ensure efficient allocation of resources within and/or between sectors and firms: competition and business dynamics, globalization and financial development.
Regarding the first group of factors, one should note that a large body of empirical literature points to a positive causal link between research and development (R&D) and TFP growth, stemming from both the private (within firm) and public R&D investment, domestic and foreign.13 Since 2008, the System of National Accounts treats the R&D expenditure (a part of the
13Recent empirical studies and literature surveys include, among others, Wieser (2005), Coe et al. (2009), Hall (2011), Ang and Madsen (2013) and Herzer (2022).
35
| Gross Domestic Product (GDP) growth since the 1980s | Bilaga 1 till LU2023 |
knowledge transfers occur through FDI, trade in intermediate and final goods and services as well as through the movement of (skilled) labor, materializing the benefits of globalization. Higher level of human capital, investment in tangible ICT capital and better quality of institutions, among other factors, show strong complementarities with R&D in its effect on TFP growth. (Guellec and Van Pottelsberghe, 2004)
The decline in trend TFP growth is not an entirely uniform phenomenon across countries14, but on average, the slump has been widespread across the developed world (see Figure 2.9). Some research has taken a stand that the TFP growth slump is a result of a diminishing ability of newer technologies to provide substantial productivity benefits (Gordon 2012), while others discuss failures of different government policies promoting innovation and, more recently, the linkages between weak investment and productivity growth that may have applied in the aftermath of the financial crisis. (Arsov and Watson 2019). Recent evidence in Gordon and Sayed (2019) in fact reveals a remarkably similar development in the U.S. and the
14For example, while some European economies experienced a persistent or
36
| Bilaga 1 till LU2023 | Gross Domestic Product (GDP) growth since the 1980s |
Figure 2.9 Trend TFP growth in selected countries (in percentage)
| 2,5 | ||
| Denmark | Germany | |
| 2 | ||
| France | Sweden | |
| 1,5 | UK | USA |
| 1 |
0,5
0
Note: The presented trend is calculated by applying the Hodrick
Source: OECD Economic Outlook Database (112) and own calculations.
After a weaker performance in the ‘80s, the development of trend TFP growth in Sweden resembled the US and the UK experience, as opposed to the developments in some other advanced European economies such as France and Germany. The second half of the ‘90s decade and early 2000s was marked by a strong TFP growth (well above 1 percent in trend TFP growth in the
The implications of the financial crisis and the Great Recession for the TFP level and growth were large.15 TFP is by itself procyclical and was driven down by the large contractions in the economies during the crises, but has remained low even in the years after the crises, raising the issue of potential
15For more details on the developments and mechanisms during the Great Recession
37
| Gross Domestic Product (GDP) growth since the 1980s | Bilaga 1 till LU2023 |
the recovery after 2010 (Tillväxtanalys 2021). Given that the TFP growth is estimated as the residual after other factors’ growth contribution to labor productivity growth have been accounted for, these findings should be assessed together with the developments in, first of all, capital deepening which has been somewhat less volatile compared to many other advanced economies.16
16Large falls in TFP growth do not necessarily reflect a reduction in the pace of technological innovation, but may come as a result of smaller contractions in capital deepening in times of large potential output growth drops. Thus, they should rather be understood as falls in efficiency growth. i.e. factors other than technology.
38
3Potential GDP – definition(s), measurement and development since the 1980s
To analyze the structural component of GDP, historically and forecasting into the future, economists employ the notion of potential output – the sustainable level of output capturing the key aspects of
Figure 3.1 Output concepts – Potential, actual and trend GDP (LHS) in billions constant SEK; GDP gap (RHS) in percentages (Sweden)
| 7 000 000 | ||
| GDP Gap | Potential GDP | 23,5 |
| 6 000 000 | ||
| GDP | GDP trend | 18,5 |
| 5 000 000 | ||
| 13,5 | ||
| 4 000 000 | ||
| 3 000 000 | 8,5 | |
| 2 000 000 | 3,5 | |
| 1 000 000 | ||
| 0 |
1993 1995 1997 1999 2001 2003 2005 2007 2009 2011 2013 2015 2017 2019 2021 2023
Note: The presented GDP trend is calculated by applying the
Source: NIER and own calculations.
39
Potential GDP – definition(s), measurement and development since the 1980s Bilaga 1 till LU2023
Over longer time horizons, as shown in Figure 3.1, one can project a fairly smooth growth path in the actual output data - the GDP trend (grey line). The trend itself is a measure fairly close to the notion of potential output (blue line), but which may diverge to a larger or smaller extent from it over periods.
Over the shorter horizons,
With the focus on the
3.1Definition of potential GDP
The potential output (GDP) in the long run17 is defined as the level of sustainable real output in the economy when all available productive
Potential GDP is to a large extent an abstract theoretical concept and is mostly shaped by structural forces characterized by a slow evolution of demographic trends, capital accumulation and technological progress. However, there is no reason to regard the potential output as a perfectly smooth path.
17At this instance,
40
Bilaga 1 till LU2023 Potential GDP – definition(s), measurement and development since the 1980s
deep and permanent policy changes, especially in the domain of fiscal policy, can change the course of the potential output. Policies that promote incentives for the development of technology, infrastructure, labor supply and human capital can have substantial implications for potential output.
Economic theory recognizes also the temporary
Shifting the focus to
41
Potential GDP – definition(s), measurement and development since the 1980s Bilaga 1 till LU2023
implications for the assessment of the current state of the economy, i.e. the output gap, and the stabilization policy.18
To a large extent, the choice of the time horizon and the precise concept and measurement method applied in the potential output analysis depends on the policy area of interest. The structural longterm analysis is concerned with the optimization of
Therefore, possible distinction between the potential output and growth concepts over the short and
Estimation methods used by main international institutions and in Sweden
Many international organizations and institutions provide estimates of potential output and its growth for advanced economies, most notably the Organisation for Economic Co- operation and Development (OECD), the International Monetary Fund (IMF) and the European Commission (EC), joined by the National agencies such as national economic research institutes and Central Banks. The estimation methods
18Recent
42
Bilaga 1 till LU2023 Potential GDP – definition(s), measurement and development since the 1980s
are very similar, mostly relying on growth accounting approach and expert judgement.
In Sweden, The National Institute of Economic Research (NIER) focuses on estimating the components of potential output when the economy is in the cyclical balance, i.e. when the resources are used normally. For unemployment, a reference period is chosen to represent the cyclical balance in the labor market and different models are used to assess how structural factors, including demographic changes, have affected equilibrium unemployment19 relative to the reference period. The size and composition of the potential labor force is determined through projections of the cyclically adjusted series using the demographic development, while potential average working time is obtained through
The Government of Sweden also relies on similar methods, production function approach and growth accounting, with the analysis and estimation of the equilibrium unemployment rate in focus20. (The Government Office 2022)
19In calculating potential labor input, i.e. hours worked, NIER relies on the concept of equilibrium unemployment instead of NAIRU
20The Government uses the
43
Potential GDP – definition(s), measurement and development since the 1980s Bilaga 1 till LU2023
3.2The development of potential GDP and components
The hypothetical nature of potential output makes it hard to measure and predict its values in the future when an economic analyst has only the real
Other more sophisticated international estimates of potential growth over the last four decades also reveal a steady decline since the
21The Euro area as a whole has as well experienced the lower reduction in potential growth trend, mostly due to milder developments in the demographic trends, although both the potential growth and the population growth are lower compared to other major advanced economies.
44
Bilaga 1 till LU2023 Potential GDP – definition(s), measurement and development since the 1980s
Figure 3.2 Potential growth in selected advanced economies,
Note: Data for years 2023 and 2024 present the OECD forecast.
Source: OECD Economic Outlook Database (112).
3.3The development of factors driving the potential
GDP
Similarly to the discussion in Section 2.2, one can analyze the trend in potential output through the lenses of its two main components, trend in hours worked and labor productivity, respectively, where each can be further decomposed into the contributing factors. By the methodology used by the main institutions providing the estimates of potential output, all the components of potential labor productivity (except capital stock) are the trend components obtained by applying the HP filter on the actual data series, where the OECD also conducts cyclical adjustment of the series prior to filtering. Capital stock is assumed to contribute to potential output in its full and thus remains unadjusted. For those reasons, the analysis of the potential labor productivity is practically the same as the one presented in Section 2.2 where the trend components of actual GDP can be interpreted also as their potential counterparts. Where most divergence between the measures of potential output
45
Potential GDP – definition(s), measurement and development since the 1980s Bilaga 1 till LU2023
and the actual series trend may occur is in the potential hours worked component which depends on the estimates of the equilibrium unemployment. The definition and the evolution of potential hour worked in the selected advanced economies is presented in Section 3.3.1
3.3.1Potential hours worked
Trend potential growth in hours worked is a measure of potential labor supply growth in the economy. It is determined by the following factors:
•Trend in the
•Trend employment rate, and
•Trend in average hours worked conditional on employment/working
The first two factors determine the potential employment of an economy in terms of the number of people working. The trend in working age population is driven by demographic forces, while the trend employment rate, as the employed workers share in the
Notable demographic changes in the advanced economies in recent decades – slower population growth and population ageing – have been reducing the trend in the potential
22Many institutions reporting the measures of potential variables rely on a
46
Bilaga 1 till LU2023 Potential GDP – definition(s), measurement and development since the 1980s
in total and per capita, respectively, as they falter the labor supply growth and the
Equilibrium employment rates in the economies facing negative developments in the
23With a notable exception of Finland which has experienced increases in employment rate.
47
Potential GDP – definition(s), measurement and development since the 1980s Bilaga 1 till LU2023
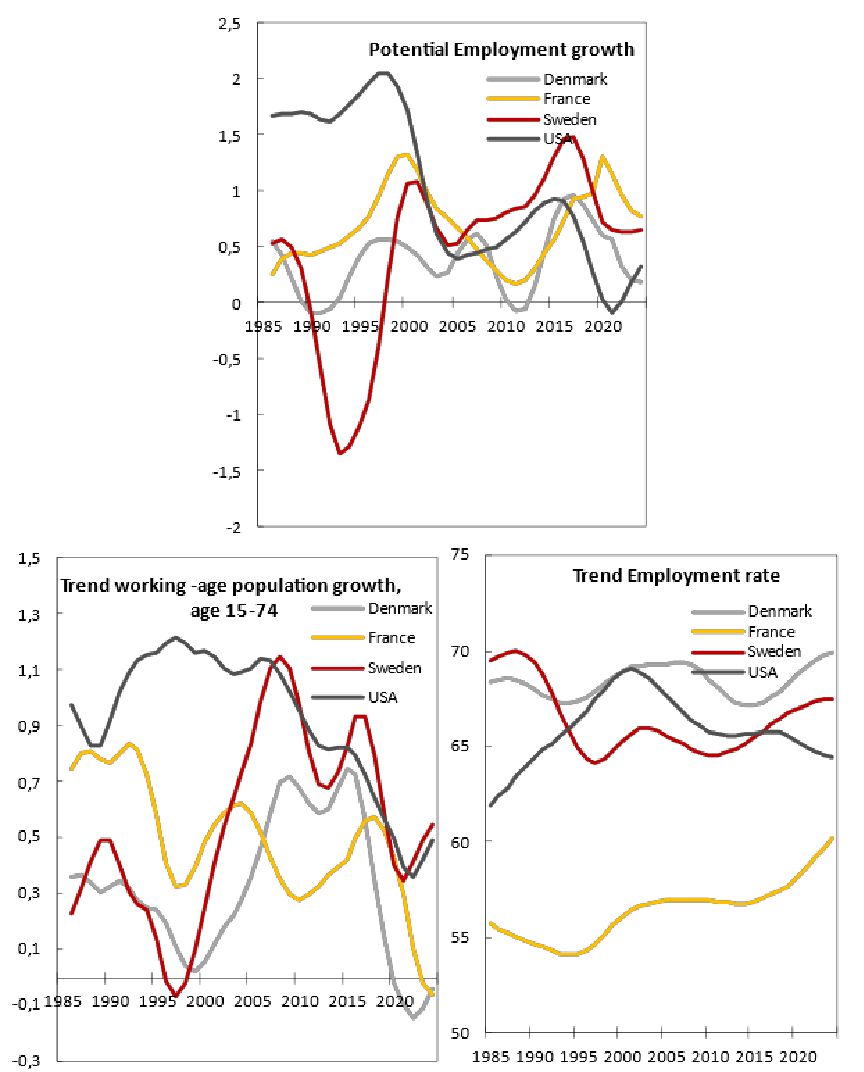
Figure 3.3 Potential Employment development, with contributing components
Source: OECD Economic Outlook Database (112).
Two factors stand behind the potential employment rate developments – the labor force participation rate and the equilibrium unemployment rate as shown in Figure 3.4. Participation rates have varied over the observed period, with somewhat stronger positive trends up to the Great Recession
48
Bilaga 1 till LU2023 Potential GDP – definition(s), measurement and development since the 1980s
positive contributors to the participation rate have been found in a finer disaggregation by gender and age.
Figure 3.4 Employment rate factors
| 80,00 | Trend Participation rate | ||||||
| 75,00 | |||||||
| 70,00 | |||||||
| 65,00 | |||||||
| 60,00 | |||||||
| Denmark | |||||||
| 55,00 | France | ||||||
| Sweden | |||||||
| USA | |||||||
| 50,00 | |||||||
| 1985 | 1990 | 1995 | 2000 | 2005 | 2010 | 2015 | 2020 |
85Trend Participation rate, female
| 80 | |||||||
| 75 | |||||||
| 70 | |||||||
| 65 | |||||||
| 60 | Denmark | ||||||
| France | |||||||
| 55 | Sweden | ||||||
| 50 | USA | ||||||
| 1985 | 1990 | 1995 | 2000 | 2005 | 2010 | 2015 | 2020 |
| 10,00 | Equilibrium Unemployment rate | ||||||
| 9,00 | |||||||
| 8,00 | |||||||
| 7,00 | |||||||
| 6,00 | |||||||
| 5,00 | |||||||
| 4,00 | |||||||
| 3,00 | Denmark | ||||||
| France | |||||||
| 2,00 | Sweden | ||||||
| USA | |||||||
| 1,00 | Sweden_NIER | ||||||
| 0,00 | |||||||
| 1985 | 1990 | 1995 | 2000 | 2005 | 2010 | 2015 | 2020 |
20Trend Participation rate, 65+
| 18 | |||||||
| 16 | |||||||
| 14 | Denmark | ||||||
| 12 | France | ||||||
| 10 | Sweden | ||||||
| USA | |||||||
| 8 | |||||||
| 6 | |||||||
| 4 | |||||||
| 2 | |||||||
| 0 | |||||||
| 1985 | 1990 | 1995 | 2000 | 2005 | 2010 | 2015 | 2020 |
Note: The presented participation rates trends are calculated by applying the
Source: OECD Economic Outlook Database (112), NIER and own calculations.
An increase in the female participation (that varied in magnitude and timing across the economies), and a notable increase in the older workers (65 years or older) participation rates, especially after 2000s have come as a continuing response to structural and policy changes as well as population ageing, respectively. However, although
49
Potential GDP – definition(s), measurement and development since the 1980s Bilaga 1 till LU2023
increasing the participation, females and old workers tend to work fewer hours which has muted the effect on potential hours worked growth24. The population is projected to age further which will expectedly bring further changes in the rates across the age segments of the
Observed stagnation or decrease in the rate of equilibrium unemployment in Figure 3.425 has contributed positively to the developments of the potential employment rates as more people in the labor force are able to find jobs. In Sweden, the equilibrium unemployment rate experienced a large increase in the early ‘90s due to a series of adverse macroeconomic shocks, and has since fallen but remains high relative to the
Finally, potential total hours worked trend draws significantly on the developments in the trend hours worked per worker, besides the trend in potential employment (Figure 3.5). Hours worked per worker have been on decline, markedly affected by the increase in the share of
24In countries with the most notable increase in the share of these groups in the labor force, average hours worked per employed have declined.
25The Figure presents the OECD data which uses the trend NAIRU equilibrium unemployment concept until 2021. For Sweden, as reported by the NIER, a
50
Bilaga 1 till LU2023 Potential GDP – definition(s), measurement and development since the 1980s
| Figure 3.5 | Trend Average Hours Worked | ||||||||||||||
| 1900 | Trend Hours worked per worker | 1000 | Trend Hours worked per capita | ||||||||||||
| 1800 | 900 | ||||||||||||||
| Denmark | |||||||||||||||
| 1700 | France | 800 | |||||||||||||
| Sweden | |||||||||||||||
| USA | |||||||||||||||
| 1600 | 700 | ||||||||||||||
| 1500 | 600 | ||||||||||||||
| Denmark | |||||||||||||||
| 1400 | 500 | France | |||||||||||||
| Sweden | |||||||||||||||
| USA | |||||||||||||||
| 1300 | 400 | ||||||||||||||
| 1985 | 1990 | 1995 | 2000 | 2005 | 2010 | 2015 | 2020 | 1985 | 1990 | 1995 | 2000 | 2005 | 2010 | 2015 | 2020 |
Note: The presented trend is calculated by applying the Hodrick
Source: OECD Economic Outlook Database (112), SCB and NIER, and own calculations.
Overall, the common feature of the advanced economies has been a decline or stagnation in the potential employment growth which has then failed to contribute to the potential output growth.
In Sweden, however, there has not been such an obvious negative overall development, Potential labor force growth has stabilized at around 1 percent, mainly due to the strong and rising participation rate in prolonged periods, and a stronger increase in the trend
51
4 Forecasts
4.1Potential growth and its deriving forces in future
According to the OECD forecasts in 2020 (Figure 4.1), the global potential output growth is projected to slow further in most advanced economies up to 2060, with a relative stagnation in European economies that have previously experienced lower rates.
| Figure 4.1 | OECD Potential Growth Forecast, 2060 | |
| 10Y annual rate average, forecast from 2020; annual growth | ||
| 4,5 | ||
| 4 | Denmark | |
| France | ||
| 3,5 | Germany | |
| Sweden | ||
| 3 | United Kingdom | |
| United States | ||
| Euro area (17 countries) | ||
| 2,5 | OECD - Total | |
| 2 | ||
| 1,5 | ||
| 1 | ||
| 0,5 |
0
| 2000 | 2010 | 2020 | 2030 | 2040 | 2050 | 2060 |
Source: OECD Economic Outlook Database (108), long
The forecast is relatively uniform across countries with all presented economies potential growth converging to
26In a global perspective, from a historical 3.6 percent in global potential output growth in the decade before the Great Recession, global economy is projected to slow down to 2.8 percent growth in the
53
| Forecasts | Bilaga 1 till LU2023 |
Demographic trends are determined to be the key factor responsible for this growth tendency.
The EU Commission forecasts on the EU countries is somewhat more optimistic (Figure 4.2). Growth on average is projected to reach 1.2 percent up to 2030, increase slightly in 2030s and 2040s, and afterwards stabilize.
Figure 4.2 EU Commission Potential growth forecast, 2060
2,5
2,0
1,5
1,0
0,5
0,0
DenmarkGermany
FranceSweden
EU
| 2019 | 2025 | 2030 | 2035 | 2040 | 2045 | 2050 | 2055 | 2060 |
Source: EU Commission, DG ECFIN 2021 Ageing Report.
The EU Commission projections as well stress out the demographic trends as the main growth reducing component, which again puts forward the future labor productivity growth as the main driver of positive developments. The forecasts on these components of potential output growth in future are presented in the sections below.
4.1.1Labor supply growth in future
Demographic trends are expected to be the most important component of the growth decline globally until 2060. After having contracted from 2 to 1 percent over the past six decades, global population growth is projected to nearly halt by 2060. Although a
54
| Bilaga 1 till LU2023 | Forecasts |
slower growing population relaxes some of the (resource) sustainability threats, it lowers the growth in labor input. OECD forecast (Figure 4.3) predict a stable decline in potential employment growth up to 2060 due to a strong contraction in
Figure 4.3 OECD Population growth and
| 1,2 | 2,0 | |||||||||||
| OECD Total | Denmark | |||||||||||
| Potential Employment growth | ||||||||||||
| 1,0 | France | |||||||||||
| Germany | ||||||||||||
| 1,5 | ||||||||||||
| Total population | ||||||||||||
| Sweden | ||||||||||||
| 0,8 | ||||||||||||
| UK | ||||||||||||
| 0,6 | 1,0 | USA | ||||||||||
| Euro area (17 | ||||||||||||
| countries) | ||||||||||||
| 0,4 | 0,5 | OECD - Total | ||||||||||
| 0,2 | ||||||||||||
| 0,0 | ||||||||||||
| 0,0 | 2000 | 2010 | 2020 | 2030 | 2040 | 2050 | 2060 | |||||
| 2000 | 2010 | 2020 | 2030 | 2040 | 2050 | 2060 | ||||||
Source: OECD Economic Outlook Database (108), long
Projections of the EU Commission are very similar (Figure 4.4). Potential labor input growth will make a negative contribution to potential output growth
27When translating the demographic changes into their effects on potential output growth, many forecasters often assume constant participation (and structural unemployment) rates which implies that a reduction in
55
| Forecasts | Bilaga 1 till LU2023 |
coupled with a decline in the average hours worked. Again, Sweden is expected to share the general potential employment trend of the other advanced economies, although at a lag and at higher levels.
Figure 4.4 EU Commission forecast on labor input components growth, 2060
| 1,5 | 1,5 | |
| Employment |
Hours worked growth | |
| Denmark | ||
| 1,0 | Germany | 1,0 |
| France | ||
| Sweden | ||
| 0,5 | EU | 0,5 |
| 0,0 | 2019 2025 2030 2035 2040 2045 2050 2055 2060 | 0,0 |
| 2019 2025 2030 2035 2040 2045 2050 2055 2060 | ||
Source: EU Commission, DG ECFIN 2021 Ageing Report.
The phenomenon of slower population growth is coupled with population ageing which increases dependency ratios and causes economic challenges for the development of potential growth per capita. Moreover, the sustainability of health and pension systems are at risk, as the share of
56
| Bilaga 1 till LU2023 | Forecasts |
Figure 4.5 Economic
Inactive population 65+ / employment
80,0
| 70,0 | ||||||||
| 60,0 | ||||||||
| 50,0 | ||||||||
| 40,0 | ||||||||
| 30,0 | Denmark | Germany | ||||||
| France | Sweden | |||||||
| 20,0 | EU | |||||||
| 10,0 | ||||||||
| 0,0 | ||||||||
| 2019 | 2025 | 2030 | 2035 | 2040 | 2045 | 2050 | 2055 | 2060 |
Source: EU Commission, DG ECFIN 2021 Ageing Report.
In the EU population, the share of people of 65 years of age or more was 20.8 percent in 2021, while this number is expected to rise to 30 percent by 2050, increasing the dependency ratio to close to 70 percent (less than two
1.9percentage points from initial 24 percent in 2019, with the health care costs being the biggest contributor to the increase. At the same time, the young population is shrinking, failing to fully replace the
57
| Forecasts | Bilaga 1 till LU2023 |
4.1.2Labor productivity growth in future
OECD (2015) notes that with the slowdown in population growth (and rise in population aging which is relevant for potential growth in per capita terms) and the limitations in human capital development which is hindered by decreasing marginal returns to education at its higher levels, the weight of TFP growth in driving future growth prospects will be rising (see Figure 4.6).
Figure 4.6 OECD Trend growth in TFP forecast, 2060
| 3,5 | ||||||
| 3 | Denmark | |||||
| Germany | ||||||
| 2,5 | Sweden | |||||
| United States | ||||||
| 2 | Euro area (17 countries) | |||||
| OECD - Total | ||||||
| 1,5 | ||||||
| 1 | ||||||
| 0,5 | ||||||
| 0 | ||||||
| 2000 | 2010 | 2020 | 2030 | 2040 | 2050 | 2060 |
Source: OECD Economic Outlook Database (108), long
Trend TFP growth is expected to rise in most presented countries up to rates of 1.5 percent by the 2040s and afterwards stabilize, except in the US where the developments are negative (shrinking to 1.2 percent).
EU Commissions predictions are somewhat more pessimistic. TFP growth as the sole source of potential output growth is expected to recover but only up to
58
Bilaga 1 till LU2023Forecasts
| Figure 4.7 | EU Commission forecasts on labor productivity growth (left) and | ||||||||||||||||||||||||||||||||
| TFP growth (right), 2060 | |||||||||||||||||||||||||||||||||
| 2,0 | 1,4 | ||||||||||||||||||||||||||||||||
| 1,8 | Labor Productivity growth | TFP growth | |||||||||||||||||||||||||||||||
| 1,2 | |||||||||||||||||||||||||||||||||
| 1,6 | |||||||||||||||||||||||||||||||||
| 1,4 | 1,0 | ||||||||||||||||||||||||||||||||
| 1,2 | Denmark | 0,8 | Denmark | ||||||||||||||||||||||||||||||
| Germany | Germany | ||||||||||||||||||||||||||||||||
| 1,0 | |||||||||||||||||||||||||||||||||
| France | France | ||||||||||||||||||||||||||||||||
| 0,6 | |||||||||||||||||||||||||||||||||
| 0,8 | Sweden | Sweden | |||||||||||||||||||||||||||||||
| EU | EU | ||||||||||||||||||||||||||||||||
| 0,6 | 0,4 | ||||||||||||||||||||||||||||||||
| 0,4 | |||||||||||||||||||||||||||||||||
| 0,2 | 0,2 | ||||||||||||||||||||||||||||||||
| 0,0 | 0,0 | ||||||||||||||||||||||||||||||||
| 2019 | 2025 | 2030 | 2035 | 2040 | 2045 | 2050 | 2055 | 2060 | 2019 | 2030 | 2040 | 2050 | 2060 | ||||||||||||||||||||
Source: EU Commission, DG ECFIN 2021 Ageing Report
At the same time, there are large uncertainties on how the future TFP growth will develop and potential failures of predictions and their implications are analyzed in the assessment of risk scenarios. Learning from the recent history, the ICT sector and the investments in tangible and particularly
59
| Forecasts | Bilaga 1 till LU2023 |
up and the revival of economic growth. Countries that host a significant share of successful global companies and
Concerning the very new technologies and their development and transmission, economists and the industry typically agree that the benefits of the second stage of the digital revolution (driven by the AI technologies) will be realized. Labeling these advances as a General Purpose Technology (GPT) economic models and historical experience tell us that the GPTs, not only require the necessary complementary resources and conditions, but also wide adoption with a significant lag. In his New York Times Opinion post Krugman (2023) debates on the two key questions: how large the productivity effects will be, and how quickly they will come about. While the first question hardly can be answered by any expert or policy maker, the answer to the second question relies greatly on our experience from the past which suggests very long lags before the AI benefits finally materialize. At least longer than what most people currently expect. Nevertheless, adoption lags are greatly affected by the policy.
4.2Potential growth developments in future Sweden
This section discusses the NIER (2022) forecasts on the future of Swedish potential output in the next decade (up until 2032) from the perspective of the main driving factors, and also those that are specific for the Swedish economy.
Predictions on the potential growth slowdown are similar to the EU commission projections. Regarding the relation of potential growth to the actual GDP growth in the near future, the Swedish economy is predicted to overcome the current negative output gap by 2026 (Figure 4.8).
60
| Bilaga 1 till LU2023 | Forecasts |
Figure 4.8 Swedish Potential GDP growth and the
3,0
2,5
2,0
1,5
1,0
0,5
0,0
| 2022 | 2023 | 2024 | 2025 | 2026 | 2027 | 2028 | 2029 | 2030 | 2031 | 2032 |
Potential GDP growth
Source: NIER 2023.
In the developments thereafter, the most important contributor to output growth in the following
In the public finance sustainability analyses by NIER made for this report, the forecast extends to 2100. Labor productivity is predicted to grow at 1.3 percent per year, and until 2050 GDP growth forecast is just above 1.5 percent per year after an initial cyclical adjustment.
61
| Forecasts | Bilaga 1 till LU2023 |
Figure 4.9 Swedish GDP growth projections with contributing factors growth, 2032
| 3,5 | ||||||||||||||||||||||||||
| 3,0 | ||||||||||||||||||||||||||
| 2,5 | ||||||||||||||||||||||||||
| 2,0 | ||||||||||||||||||||||||||
| 1,5 | ||||||||||||||||||||||||||
| 1,0 | ||||||||||||||||||||||||||
| 0,5 | ||||||||||||||||||||||||||
| 0,0 | ||||||||||||||||||||||||||
| 2022 | 2023 | 2024 | 2025 | 2026 | 2027 | 2028 | 2029 | 2030 | 2031 | 2032 | ||||||||||||||||
| GDP | Hours worked | Labor productivity | ||||||||||||||||||||||||
Source: NIER 2023.
Potential labor input growth
The labor input growth predictions are in line with the forecasts of international institutions in terms of the downward trend and the resulting potential employment and hours worked growth rates in 2032 (0,4 percent). A fall in the potential labor force growth (stemming from
62
| Bilaga 1 till LU2023 | Forecasts |
Figure 4.10 Potential hours worked growth with components (equilibrium unemployment right axis), 2023
| 1,2 | 7,5 | ||||||||||||||||||||||||||
| 1,0 | 7,4 | ||||||||||||||||||||||||||
| 7,4 | |||||||||||||||||||||||||||
| 0,8 | |||||||||||||||||||||||||||
| 7,3 | |||||||||||||||||||||||||||
| 0,6 | |||||||||||||||||||||||||||
| 7,3 | |||||||||||||||||||||||||||
| 0,4 | |||||||||||||||||||||||||||
| 7,2 | |||||||||||||||||||||||||||
| 0,2 | Potential hours worked growth | Potential employment growth | 7,2 | ||||||||||||||||||||||||
| Potential labor force growth | Equilibrium unemployment | ||||||||||||||||||||||||||
| 0,0 | 7,1 | ||||||||||||||||||||||||||
| 2022 | 2023 | 2024 | 2025 | 2026 | 2027 | 2028 | 2029 | 2030 | 2031 | 2032 | |||||||||||||||||
Source: NIER 2023.
It is argued that structural transformation in the economy brings increases in the separation rates of
63
| Forecasts | Bilaga 1 till LU2023 |
Potential labor productivity growth
Figure 4.11 Potential productivity growth and the productivity gap, 2023
| 2,0 | ||||||||||||||||||||||||
| 1,5 | ||||||||||||||||||||||||
| 1,0 | ||||||||||||||||||||||||
| 0,5 | ||||||||||||||||||||||||
| 0,0 | ||||||||||||||||||||||||
| 2022 | 2023 | 2024 | 2025 | 2026 | 2027 | 2028 | 2029 | 2030 | 2031 | 2032 | ||||||||||||||
| Potential productivity growth | ||||||||||||||||||||||||
| Productivity gap, % of potential labor | ||||||||||||||||||||||||
| productivity | ||||||||||||||||||||||||
Source: NIER 2023.
Potential productivity growth is expected to rise from 1 percent to 1,2 percent by 2025 and then experience another rise by 0,1 percentage point by 2029 where it will stabilize. The negative productivity gap is projected to turn slightly positive in 2026 and diminish thereafter (Figure 4.11). Several important factors for the productivity development are put forward.
Technological change is virtually impossible to predict, but judging by the innovation climate and incentives, the NIER predicts a rise in its pace in the near future. Furthermore, technical transformation towards production that uses sustainable energy sources may be
64
| Bilaga 1 till LU2023 | Forecasts |
consequences for the growth rate as the sectors experience very different rates of productivity growth. Public (excluding health) and health sectors both have lower productivity growth rates compared to the business (private) sector. The public sector is projected to experience very weak productivity growth rates in the next decade, while the health sector is expected to increase its share in the total economy as the population ages, each in turn contributing to the aggregate economy reducing its productivity growth further relative to the business sector.
4.2.1Lasting scarring effects and benefits of the big crises
Large economic, natural and
Most advanced economies have rebounded their productivity growth rates to a larger or lesser degree during the decade following the financial crisis and the resulting Great Recession
On the other hand,
65
| Forecasts | Bilaga 1 till LU2023 |
Possible
Two main consequences of the Great Recession are discussed in the literature. First, longer spells of unemployment have had negative consequences on
Another caveat relates to the uncertainty on the magnitude and implication of the “cleansing effect” of the Great Recession. Recessions drive unproductive firms out of business and reallocate resources towards more productive firms and their more efficient use, ultimately raising aggregate productivity. The question surrounding the Great Recession is whether its cleansing effect has been too harsh. Some evidence on the U.S. economy shows that the recessionary effects were similar as in previous episodes but less
The economic research and literature on the
66
| Bilaga 1 till LU2023 | Forecasts |
As with the Great recession, the “cleansing effect” operating at the
On the positive note, the pandemic has incentivized the adoption of digital technologies and teleworking. Although it is very hard to establish a causal relationship between digitalization and productivity growth (as more productive firms can also be expected to have higher incentives and capacity to invest in digitalization), but at the aggregate level, acknowledging the reallocational effects, recent trends on productivity of the digitally intensive sectors point to further productivity benefits due to their higher ability to adapt to the new conditions. Teleworking, on the other hand, involves several effects that are perhaps easier to identify but include both positive and negative factors so that the overall assessment is hard to establish. The future forecasts on the summarized relationship between teleworking and workers efficiency may well prove to be of an inverted
4.3Greening of the economy – important factors in future potential growth
In order to reach the goal of net carbon neutrality by 2050 (2015 Paris Agreement), world economies need to conduct large and rapid policy interventions. By 2030, global emissions need to be reduced by at least 25 percent compared to today’s levels which among other things requires greenhouse gas (GHG) emission taxes, emission trading systems, government regulation of emissions and investment in
67
| Forecasts | Bilaga 1 till LU2023 |
policy makers around the world have been significant, against the widely accepted agreement that consequences of inaction may be catastrophic and that the
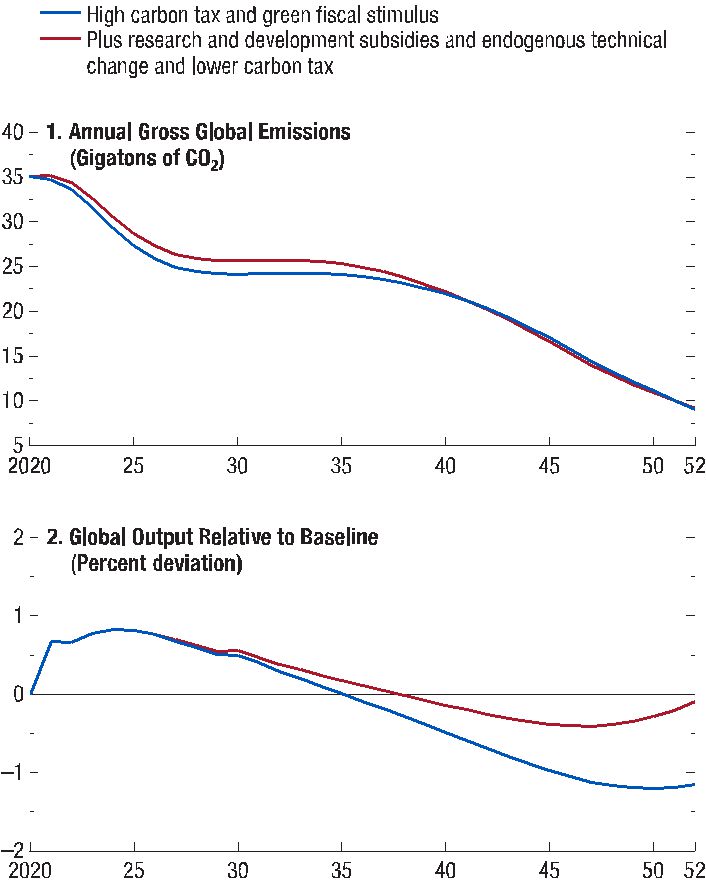
The IMF World Outlook 2020 reports the results of the analysis of the effects of climate mitigation policy on climate problems and the economic outcomes of the global economy. Optimal policy package (in terms of reaching the agreed limits for emission and global temperature rise) costs are moderate while they are expected to have net positive effect on global growth in the initial years, supporting the recovery from
68
| Bilaga 1 till LU2023 | Forecasts |
Figure 4.12 Mediumto
Percent of baseline GDP
Note: The figure shows the variation over output gains from climate change mitigation due to
uncertainty from two sources: local costs of higher temperatures, from either Nordhaus (2010) or Burke, Hsiand, and Miguel (2015); and climate sensitivity, measured as the increase in long
Source: IMF staff estimates, IMF World Outlook 2020 .
Important aspect of climate mitigation policy and investment is its ability to generate significant returns to the support of technological innovation, largely absent from the models used to conduct policy scenario evaluations. Carbon taxes and green R&D subsidies both affect technological innovation and produce long run growth benefits. It is estimated that the resulting technical change stemming from changes in carbon prices and a complementary 70 percent subsidy would reduce the needed carbon prices for achieving the emissions targets by half, compared to the scenario without the technical change channel. At the same time, focusing on the period until 2050, the actual GDP would be starting to approach the baseline earlier, around
28The figure is comparing the scenario accounting for the technical change, (lower) carbon tax, fiscal stimulus and R&D subsidies to the scenario with only carbon tax and fiscal stimulus
(though it’s a high carbon tax here). Thus, carbon tax is included in both, just showing that it
69
| Forecasts | Bilaga 1 till LU2023 |
stemming from the nature of technological innovation and diffusion is the fact that the positive effects come only after a certain lag, i.e. after 2030, relative to a scenario without R&D subsidy and endogenous technical change.
Finally, another aspect of green technologies spillovers should be noted. New energy sources and decarbonizing technologies may provide significant productivity benefits, but it may as well be the case that the climate transition will bring about negative pressures on potential GDP growth due to a reallocation of investments to climate adaptation purposes. These investments may raise the
may be lower if we allow for the assumption on positive technological change. It may be argued that the market allocation should be more efficient, but we should also account for this important growth driving channel.
70
| Bilaga 1 till LU2023 | Forecasts |
Figure 4.13 The role of Green Technological Change
Note: The panels compare the
Source: IMF staff estimates, IMF World Outlook 2020.
The recent IMF World Outlook 2023 report points to several challenges in the climate change mitigation policy. The global financial crisis and the war in Ukraine that have led to a retreat from
71
| Forecasts | Bilaga 1 till LU2023 |
mitigation. While there are encouraging signs of international cooperation on adaptation to climate change, more needs to be done, including channeling aid to vulnerable countries. Furthermore, the International Energy Agency predicts an 80 percent reduction in global fossil fuel extraction by 2050, requiring a significant reduction in production. This could have economic repercussions for fossil fuel exporters, as the industry negatively impacts a country's economic growth and institutions, as well as on their trading partners. A new data set on oil, coal, gas, and metal extraction from 1950 to 2020 identifies that a typical episode of contraction is a 10 percent contraction in extraction activity in the episode's first year that cumulates to a 40 percent reduction over 10 years. The macroeconomic effects of these declines are negative, with a typical episode leading to a 1 percent initial decline in real GDP, a 5 percent decline after five years, and a slow depreciation of the real exchange rate. The impact on manufacturing and services sectors is significant and negative, with a negative impact on employment. The estimated GDP impact is larger for middleand
72
5 Discussion
5.1What do the forecasts show? Discussion
The forecasting work is an interplay between models and assessments. To varying degrees, models assume that history repeats itself or that economic relationships are stable over time, and therefore they also need to be supplemented by analyses and judgements by experts who have an insight into mechanisms and economic developments that the models do not always capture. The overall information from the models is finally weighed together with other information to produce forecasts for economic activity and inflation. The experts’ assessments become particularly important when unusual events and/or structural changes that alter the functioning of the economy take place. (Riksbanken, 2022)
Forecasting potential output and its growth in the near future and in the long run implies facing difficult tasks. Producing some medium run projections involve the assessment of the prolonged economic implications of the
Predicted demographic changes are difficult to discuss from the stand point of an economic policy makers. These developments are driven by the deep structural processes and the variables such as fertility rates are difficult to tackle with a single or a small set of policies. Favorable developments require a whole environment of
73
| Discussion | Bilaga 1 till LU2023 |
good economic and social conditions over a prolonged period. This is not to say that policy cannot affect potential labor input growth. Indeed, the forecasts show that economies that manage to sustain labor force inflow that matches the skill requirements of jobs across industries and that have
At the global level, views on the future of TFP growth have become polarized. The
In the aspects currently considered to be the most relevant for the TFP growth (as discussed in previous sections), Sweden is well equipped to expect stable if not positive developments in TFP growth. Both
74
| Bilaga 1 till LU2023 | Discussion |
most sectors and firms, with large firms, employing the major share of the labor force, being more
Globalization has proved to incentivize labor reallocation across industries and firms, promoting better
5.2Important remaining factors
World economy is a highly integrated network of regions, markets, and global production chains. The use of digital technologies is erasing the borders even further. Virtually every economic decision has to be based on the information about conditions in various segments of those networks, and every action has implications for other parties involved. From this perspective, two policy aspects which will certainly have implications for the development of potential output in the near and far future should be mentioned as some final remarks.
Climate change as an international challenge
Judging from the experience of many countries, Goldman Sachs (2022) argues that there is no necessary strong negative correlation between potential economic growth and environmental
75
| Discussion | Bilaga 1 till LU2023 |
sustainability, and the policies designed to tackle each of the issues can be
However, the climate change issues cannot be addressed independently from other countries. Sweden is at the forefront in terms of the implemented policies but the effectiveness of these policies in fighting the climate problems will depend on the policy responses of other economies. This in turn may require recalibration of the national policies and a possibly larger negative effects on potential GDP growth, at least in the
Globalization – reversal (deglobalization), slowdown (slowbalizations) or the rise of new forms?
Globalization has proved to be a powerful force in shaping living standards and income distribution across the world over the major part of our economic history, only to be interrupted by large recession episodes often accompanied by a rise in protectionist policies. Having experienced two of the largest crises in just 15 years, an unprecedented disruption in globalization momentum has followed. As globalization and technological progress are highly interlinked processes, this creates increased risks for the evolution of TFP. Moreover, continuing efficiency gains in the future will largely depend on the countries’ tendency to revert to protectionism. Goldman Sachs (2022) predicts a slowdown in the following decade(s), with the risk of deglobalization always present. Swedish economic agents have understood the benefits of globalization for a small open economy early, but the future benefits in Sweden are crucially dependent on the decisions and policies of other players in the global markets. A hardly predictable mix of political, technological and economic factors and shocks that is driving technological development in a globalized world is largely out of the reach of national policies, but is an important factor to take into account when producing potential productivity and growth forecasts.
76
| Bilaga 1 till LU2023 | Discussion |
5.3Scope for methodological improvement
Currently used potential GDP measurement methods by NIER, among others, largely disregard the lower frequency supply shocks when estimating potential productivity. The intention is to capture only the long run, structural
Furthermore, as noted by the OECD regarding their measurement, the coefficients relating external measure of cyclical indicators to labor efficiency or participation needs constant updating for the proper estimation of the potential GDP components.
On the other hand, as the OECD points out in the description of its method (Chalaux and Guillemette, 2019),
Finally, inclusion of the natural resource capital for greater degree of freedom in making forecasts on the climate change policy effects, as well as different measurement techniques for the aspects related to the Digital economy and the rise in consumer welfare, are just some of the possible venues for methodological improvement.
77
References
Acemoglu, Daron (2007). Introduction to Modern Economic Growth. USA: Massachusetts Institute of Technology.
Aghion, Philippe, David Hemous, and Enisse Kharroubi. (2014). Cyclical fiscal policy, credit constraints, and industry
growth. Journal of Monetary Economics, 62, pp.
Ang, James.B. and Jakob B. Madsen (2013). International R&D Spillovers and Productivity Trends in the Asian Miracle Economies. Economic Inquiry, 51(2), pp.
Araujo, Carlos Hamilton (2009), The Role of Potential Output Growth in Monetary Policymaking in Brazil. Federal Reserve Bank of St. Louis Review, 91(4), pp.
Arsov, Ivailo and Benjamin Watson (2019). Potential Growth in Advanced Economies. Reserve Bank of Australia, Bulletin- December 2019, Global Economy.
Barro, Robert J. (2006). Rare disasters and asset markets in the twentieth century. Quarterly Journal of Economics, 121 (3), pp.
Barro, Robert J. and
Basu, Susanto and John G. Fernald (2009). What Do We Know (And Not Know) About Potential Output?. Federal Reserve Bank of St. Louis Review, 91(4), pp. 187
Baziki, Selva B., Borota Milicevic, Teodora and Rita Ginja (2016). Trade Competition, Technology and Labor
79
| References | Bilaga 1 till LU2023 |
Bernanke, Ben S. (1983).
Blagrave, Patrick, Mr Roberto
Bloom, Nicholas, Sadun, Raffaella and John Van Reenen (2012). Americans do I.T. better: US multinationals and the productivity miracle. NBER Working Paper Series, Working Paper 13085.
Bontadini, Filippo, Carol Corrado, Jonathan Haskel, Massimiliano Iommi, and Cecilia
Boianovsky, Mauro and Kevin D. Hoover (2009) The Neoclassical Growth Model and 20th Century Economics. History of Political Economy, 41,
Bresnahan, Timothy.F., Brynjolfsson, Erik and Lorin M. Hitt. (2002). Information Technology, Workplace Organisation and the Demand for Skilled Labor:
Burke, Marshall, Hsiang, Solomon M. and Edward Miguel (2015). Global
Cahn, Christophe and Arthur
Chalaux, T. and Y. Guillemette (2019). The OECD potential output estimation methodology. OECD Economics Department Working Papers, No. 1563, OECD Publishing, Paris,
Coe, David T., Helpman, Elhanan, and Alexander W. Hoffmaister (2009). International R&D spillovers and institutions. European Economic Review 53(7), pp.
80
| Bilaga 1 till LU2023 | References |
Coibion, Olivier, Gorodnichenko, Yuriy and Mauricio Ulate, M (2018). The Cyclical Sensitivity in Estimates of Potential Output. Brookings Papers on Economic Activity, 2018(2), pp
Corrado, Carol, Charles Hulten, and Daniel Sichel. (2009). Intangible capital and US economic growth. Review of income and wealth, 55(3),
Corrado, Carol, Haskel, Jonathan, Iommi, Massimiliano and Cecilia
Cotis,
Davidson, Carl, Heyman, Fredrik, Matusz, Steven, , Fredrik and Susan Chun Zhu (2012). Liberalized Trade and
Dieppe, Alistair and M.Ayhan Kose (2020). The Global Productivity Slump: What policies to rekindle. The Brookings Institution, November 2020.
European Central Bank (2022). The impact of the
European Commission (2021). The 2021 Ageing Report: Economic
&Budgetary Projectionsfor the EU Member States
European Commission (2023). The impact of demographic change – in a changing environment. Commission Staff Working Document 21.
Gancia, Gino and Fabrizio Zilibotti (2005). Horizontal Innovation in the Theory of Growth and Development. Handbook of Economic Growth, in: Philippe Aghion & Steven Durlauf (ed.), Elsevier, edition 1, volume 1, chapter 3, pp.
Girouard, Nathalie and Christoph André (2005). Measuring
81
| References | Bilaga 1 till LU2023 |
Goldman Sachs (2022). The Path to 2075 – Slower Global Growth, But Convergence Remains Intact. Global Economics Paper.
Gordon, Robert J. (2012). Is US Economic Growth Over? Faltering Innovation Confronts the Six Headwinds. NBER Working Paper 18315, National Bureau of Economic Research, Cambridge, MA.
Gordon, Robert J., and Hassan Sayed (2019). The Industry Anatomy of the Transatlantic Productivity Growth Slowdown. NBER Working Paper 25703, National Bureau of Economic Research, Cambridge, MA.
Governement Office (2022). Method for the calculation of potential variables november 2022. Ministry of Finance, International and Economic Department, Promemoria.
Guellec, Dominique and Bruno Van Pottelsberghe De La Potterie (2004). From R&D to productivity growth: Do the institutional settings and the source of funds of R&D matter? Oxford Bulletin of Economic and Statistics, 66 (3), pp.
Hall, Bronwyn H. (2011). Innovation and productivity. NBER Working Paper 17178, National Bureau of Economic Research, Cambridge, MA.
Herzer, Dierk (2022). The impact of domestic and foreign R&D on TFP in developing countries. World Development, 151.
International Monetary Fund (2020). World Economic Outlook, A Long and Difficult Ascent, IMF October 2020.
International Monetary Fund (2023). World Economic Outlook, A Rocky Recovery, IMF April 2023.
Jakobsson, Ulf (2007). The Globalisation of Swedish Economy. Confederation of Swedish Enterprise, 430.
Jones, Larry E. and Rodolfo E. Manuelli (2005). Neoclassical Models of Endogenous Growth: The Effects of Fiscal Policy, Innovation and Fluctuations. Handbook of Economic Growth, in: Philippe Aghion & Steven Durlauf (ed.), Handbook of Economic Growth, Elsevier, edition 1, volume 1, chapter 1, pp.
Jovanovic, Boyan Peter L. Rousseau (2005). General Purpose Technologies. Handbook of Economic Growth, in: Philippe Aghion & Steven Durlauf (ed.), Handbook of Economic
82
| Bilaga 1 till LU2023 | References |
Growth, Elsevier, edition 1, volume 1, chapter 18, pp.
Krugman, Paul. (2023), A.I. May Change Everything, but Probably Not Too Quickly. New York Times (March 2023).
Lippi, Francesco (2003). Monetary policy with unobserved potential output. Bank for International Settlements, BIS Papers No.19, part 11.
Lundborg, Per, Vartiainen, Juhana and Göran Zettergren (2007). Den svenska jämviktsarbetslösheten: En översikt av kunskapsläget. NIER Special study No.11.
Nanda, Ramana, and Tom Nicholas. (2014). Did bank distress stifle innovation during the Great Depression? Journal of Financial Economics, 114(2), pp.
NIER (2008). Hours, Capital and Technology – What Matters Most? Occasional Studies No. 17.
NIER (2015). En beskrivning av hur Konjunkturinstitutet beräknar potentiell BNP. Prognosavdelningen.
NIER (2021). Lönebildningsrapporten 2021. NIER. NIER (2022). Lönebildningsrapporten 2022. NIER.
Nordhaus, William D. (2010). Excel file for RICE model as of April 26, 2010. Ann Arbor, MI: Interuniversity Consortium for Political and Social Research [distributor],
OECD (2001), Measuring Productivity – OECD
Manual: Measurement of Aggregate and
Productivity Growth, OECD Publishing,
Paris,
OECD (2013a). OECD Employment Outlook. OECD Publishing.
OECD (2013b). New Sources of Growth:
OECD (2015). The Future of Productivity. OECD Publishing.
OECD (2016a) Links Between Weak Investment and the Slowdown in Productivity and Potential Output Growth Across the OECD. OECD Economics Department Working Papers No.1304.
OECD (2016b). Getting Skills Right: Sweden, Getting Skills Right. OECD Publishing.
83
| References | Bilaga 1 till LU2023 |
OECD (2020). OECD Economic Outlook No 108 (Edition 2020/2). OECD Economic Outlook: Statistics and Projections (database),
OECD/APO (2022). Identifying the Main Drivers of Productivity Growth: A Literature Review. OECD Publishing, Paris.
OECD (2022). OECD Economic Outlook No 112 (Edition 2022/2). OECD Economic Outlook: Statistics and Projections (database),
Orphanides, Athanasios (2003. The Quest for Prosperity without Inflation. Journal of Monetary Economics 50, pp.
Romer, Paul M. (1986). Increasing Returns and
Schembri, Lawrence (2018). The (Mostly) Long and Short of Potential Output. Remarks by the Deputy Governor of the Bank of Canada, Ottawa Economics Association and CFA Society Ottawa.
Solow, Robert M. (1956). A contribution to the theory of economic
growth. Quarterly Journal of Economics. 70 (1), pp.
Solow, Robert M. (1957). Technical change and the aggregate production function. Review of Economics and Statistics, 39 (3), pp.
Tillväxtanalys (2018). Hur kan staten främja användandet av digitaliseringens möjligheter i näringslivet? Rapport 2018:01.
Tillväxtanalys (2021). Produktivitetstillväxt och dess drivkrafter – Sverige ur ett internationellt perspektiv. Rapport 2021:09.
Wieser, Robert (2005). Research and development productivity and spillovers: Empirical evidence at the firm level. Journal of Economic Surveys, 19(4), pp.
Williams, John C. (2017). The Perennial Problem of Predicting Potential. Economic Letter, Research from Federal Reserve Bank of San Francisco,
World Bank (2021). Global Productivity: Trends, Drivers, and Policies. Editor Alistair Dieppe, The World Bank Group.
84
Appendix A: The theories of economic growth
Economic growth has long been one of the main topics of economic literature and debates, but the modern analysis relying on formal mathematical models became the central theme of macroeconomics and economic theory in the 1950s. Seminal contributions by Robert Solow (1956, 1957) incentivized
Before the
Neoclassical growth theory
At the core of neoclassical growth theory (including the Solow growth model as its main representative) is the neoclassical aggregate production function which, as opposed to the Harrod- Domar framework, introduces diminishing returns to individual production factors. This implies that the benefits of additional capital accumulation become exhausted over time and the economy converges to a
85
| Appendix A | Bilaga 1 till LU2023 |
The only factor that can bring sustained growth in output and capital per worker, i.e. growth in living standards, is the sustained technological progress, offsetting diminishing returns to capital accumulation and steadily promoting labor productivity. Although the model points to the main
Neoclassical growth theory included a wide range of models, from perfectly competitive to those modeling and analyzing various imperfections and market failures. The most prominent of the extensions has been the neoclassical study of the role of human capital and knowledge in economic growth. Although many models have provided plausible answers to why some countries development is more successful than that of others and why social institutions matter crucially, this model class did not explain how sustained economic growth is actually created and maintained over time. (Jones and Manuelli 2005)
One of the first models to address this key issue was the AK model which relaxed the central assumption of diminishing returns to capital and featured sustained endogenous economic growth coming from the inside of the economic system as a result of continuous capital accumulation. Importantly, it opened the avenue for policy implications with respect to economic growth in the long run. This model led to further developments, ultimately the Romer’s model (Romer 1986) that started the endogenous growth theory.
Endogenous growth theory
In his pursuit of the explanations of the
86
| Bilaga 1 till LU2023 | Appendix A |
scale and sustained growth, and second,
Complementary approach in the introduction of deliberate innovation activity in the growth model was to assume that research and development results in quality improvements of goods, replacing the previously invented versions (“vertical innovation”). This process of “creative destruction” was motivated by Schumpeter’s ideas. Alternatively, “process innovation” created cost reductions that again drove the competitors out of the market. At the same time, these types of models with competitive innovation bring the issues of industrial organization and
Another issue regarding the treatment of technological progress in the literature is worth noting. A branch of literature paid special attention to the notion of “General Purpose Technologies” (GPT) which refers to technological changes that transform the businesses
87
| Appendix A | Bilaga 1 till LU2023 |
and the way of living fundamentally. Technological development is recognized as uneven, coming in bursts in the form of GPT’s. Of particular interest today is the notion of Information Technology (IT) as a GPT, often compared to the electrification and the profound effects it had on the societies. While electrification was argued to be more broadly adopted, IT is considered as more revolutionary. More importantly, the productivity slowdown that was discussed broadly in the text and that has caused so much debate and concern, is regarded as a normal development through the lenses of the GPT growth models. While we have experienced a somewhat stronger productivity slowdown compared to that in the era of electrification, the continuing adoption and the fall in relative price of IT is probably a good reason for optimistic predictions on future developments of labor productivity. (Jovanovic and Rousseau 2005).
Heterogenous firms and industry dynamics
As mentioned in the text, the potential growth contributors typically interact with each other producing both positive and negative spillovers which then have important implications for the labor productivity and potential output growth. Human capital may increase returns to innovation and produce spillover to TFP, TFP trend affects investment climate, and investment in intangible capital incentivizes innovation and dampens the traditional notion of decreasing returns to factors. All these links and interactions were basically invisible in the countryand
88
| Bilaga 1 till LU2023 | Appendix A |
reallocation of resources across firms within the industries (World Bank 2021). This is still a relatively young and active area of research but has provided evidence from the firm level analysis that has helped us first describe and then understand the determinants and changes of aggregate productivity. Some of the most recently debated phenomena refer to a still understudied effect of globalization - the role of superstar global firms in raising industry concentration and market power, and the associated implications for potential productivity growth in the long run.
89
Appendix B: Decomposition of output growth
Output growth (ŷ), by identity, is a sum of the growth in hours worked (ĥ) and the growth in output per hour
ŷ = ĥ + (ŷ − ĥ)
Turning to the production function, output growth can be expressed as the sum of the input factors growth, where these growth rates are weighted by the contribution of each of the factors
| to the output, | ||
| ̂ | ̂ | ̂ |
| ŷ = ����� + ��� + (1 − ��)�, | ||
| ̂ | ̂ | the growth rate of labor |
| with � as the growth rate of capital, � | ||
input, ̂ as the growth rate of total factor productivity (tfp), while �����
αand
The labor input has two components – the amount of labor (in hours worked) and the quality of labor input (lq) in terms of its skills
| ̂ ̂ | ̂ | |
| and ability, so one can define the growth in labor input as � = ℎ + ��, | ||
| ̂ | ̂ | ̂ |
and derive the labor productivity growth as (ŷ − ℎ) = ����� + ��(� −
̂̂ , where ̂ ̂ stands for capital deepening or growth in
�) + �� (� − �)
capital per unit of labor input. Subsequently, one can analyze the trend growth in output through the lenses of its two main components, trend growth in hours worked and labor productivity, respectively,
̂ ̂ ̂ ̂
ŷ = ĥ + [����� + ��(� − �) + ��].
91
Appendix C: The definition of potential GDP in academic literature and DSGE- models
In the academic literature and in dynamic stochastic general equilibrium (DSGE) models in particular, potential GDP is defined differently than the way it is commonly defined by forecasters (see main text). In the New Keynesian theory, potential GDP is defined as the level of production that would occur if all prices and wages were fully flexible, i.e. they immediately adapt to changing economic circumstances. According to the theory, inertia in prices and wages is the reason why actual GDP generally differs from the potential level. In a market economy, prices and wages convey information between different firms and between firms and households. Prices convey information to households about companies' cost situation: different companies' relative prices signal how their relative production costs differ. If prices are sluggish, i.e. if there are nominal rigidities there is a risk that households get the wrong signals about the relative costs and therefore demand too many products. This can lead to
Therefore, a notable feature of the aggregate economy’s cyclical behavior stems from the (undesired) movements in relative prices
29One should, however, note that when an economy is operating at its potential level, and have a normal resource utilization, that alone does not mean that the economy grows in accordance with its
93
| Appendix C | Bilaga 1 till LU2023 |
due to a slow and
30In a market economy, the core factor motivating the saving and investment decisions of economic agents, thus driving productive capital accumulation, is the real interest rate. On an
31For a more extensive discussion see Appendix D and Section 3. It may also be worth noting that neither the
94
Appendix D: Measuring potential growth
Section 3 defined potential output and its growth, and showed developments in the last four decades. In this appendix we will discuss the methods that are used to measure potential GDP.
Potential output is very hard to measure. When it comes to the calculation and estimation of potential GDP, its driving components and their corresponding growth, there are at least three major obstacles. First, the economics data (both the actual GDP and its components) are continuously revised for improved precision which makes it difficult to settle the estimate of potential growth on any horizon. Second, newly incoming information about history and the information resulting from new economic events change the predictions on the behavior of the underlying
Measuring issues concerning potential output are of substantial interest to policymakers for several different reasons. First, these estimates provide a sense of the structural performance of the economy and the potential growth rates that could be attained. Therefore, these estimates are important for macroeconomic forecasts. Second, potential output measures allow for the construction of the output gap - the difference between actual
32It is not rarely the case that economic analysts have made overly optimistic estimates of potential output growth that have had significant implications for the effects of the applied policy measures (e.g. the overestimation of the US potential output in the ‘60s and ‘70s, see
Orphanides 2003). Therefore, any estimate that is used for the analysis of the potential growth and its driving factors should be taken with a significant degree of caution. (Williams 2017)
95
| Appendix D | Bilaga 1 till LU2023 |
output and potential output – which is a useful indicator of the economy’s position in the business cycle and the prevailing inflationary pressures. Third, potential output measures are used to make cyclical adjustments of other variables, e.g. tax revenues and government spending which then provides estimates of structural fiscal deficits.
By construction, potential output should capture the movements in output that are driven by
The revisions of the
96
| Bilaga 1 till LU2023 | Appendix D |
Figure D.1 Potential growth estimate uncertainty, IMF (source: Arsov and Watson 2019)
Change from contemperaneous estimate by years since estimate
Note: IMF estimates from 2000 to 2019 for Canada, France, Germany, Italy, Japan, Spain, United Kingdom and United States
Sources: IMF; RBA
Methods and comparisons across uses
There is a large diversity in methods for measuring potential output and potential growth, typically grouped in two main categories – purely statistical and
Purely statistical methods
The standard technique in the purely statistical group of methods is the univariate approach which uses only the data on GDP and decomposes it statistically into the trend and cyclical components, where the trend presents the potential output by assumption. The most common are statistical filters, including the
97
| Appendix D | Bilaga 1 till LU2023 |
decompositions. A complementary approach is the multivariate one (Blagrave et al., 2015), originating in the Okun’s (1962) definition of potential output as the level of output which can be achieved without giving rise to inflation. This then points to the movements in other variables, specifically inflation and unemployment rate, in relation to the movements in potential output and output gap. The structure of the filter links the output gap to the labor market and changes in inflation. When inflation is persistently below the target, this method would yield higher estimates for potential output. The method requires only the data on output, inflation and unemployment, and the estimates are more robust in
In the second group of methods, the
98
| Bilaga 1 till LU2023 | Appendix D |
Growth accounting33 starts from the aggregate production function (typically, a
Structural models’ approach
Some policy and international institutions, in particular the Central Banks conducting monetary policy, rely on the use of structural macroeconomic models (typically New Keynesian DSGE models) which describe the behavior of the main macroeconomic variables in response to various shocks hitting the economy. In recent decades, the
33In this context, growth accounting should be understood differently from the historical data growth accounting that is assessing the actual contributing components of realized output. In potential growth accounting exercise, all factor components and the resulting potential growth are in fact assessments or estimates of the potential trends.
99
| Appendix D | Bilaga 1 till LU2023 |
statistical and production function approaches which tend to strip out the cyclical components from the estimates of trend potential output. (Coibion et al. 2018)
The initial practice of using the DSGE model approach, particularly in the interest of deriving the output gap, unveiled differences in the measures of potential output obtained from the DSGE models and the production function approach, where the latter tend to show less variability. However, once the production function measure is incorporated fully into a DSGE framework, the two approaches tend to converge and the
100
| Bilaga 1 till LU2023 | Appendix D |
Methods used by International and Domestic institutions
Table D5.1 Sources of Potential Growth estimates, advanced economies
| Countries | Method | Frequency | |
| IMF | Advanced economies | Growth accounting measure, | Semi- |
| and some emerging | aggregated using |
annual | |
| economies | production function | ||
| OECD | Advanced economies | Growth accounting measure, | Annual |
| aggregated using |
|||
| production function | |||
| EU Commission | 28 members of | Growth accounting measure, | Semi- |
| European Union | aggregated using |
annual | |
| production function | |||
| Bank of Canada | Canada | Growth accounting measure, | Quarterly |
| aggregated using |
|||
| production function | |||
| Bank of Japan | Japan | Growth accounting measure, | Quarterly |
| aggregated using |
|||
| production function | |||
| Federal Reserve Bank | U.S, Canada, Euro | Multivariate estimator | Quarterly |
| of New York (Holston- | area, U.K.. | ||
| Congressional | U.S. | Growth accounting measure, | Semi- |
| Budget Office | aggregated using |
annual | |
| production function | |||
| Office for Budget | U.K. | Multivariate Estimator | Annual |
| Responsibility | |||
| Japan Cabinet Office | Japan | Growth accounting measure | Quarterly |
| NIER | Sweden | Growth accounting measure | |
101
Appendix E: Effect of large crises on potential output and growth
Two economic shocks of unprecedented magnitude in the recent history - the Great recession of 2007 and the
Great Recession
Investment growth has slowed down significantly in the aftermath of the Great recession as a result of, among other factors, higher policy uncertainty, unfavorable
A part of the reduction, particularly in residential investment as a share of GDP, is directly linked to the global financial crisis of 2007, while the other parts of the weakening investment phenomenon stem from the accelerator response of investment to the negative demand shock associated with the crisis. This has been labeled the hysteresis effect in the literature where a continued low demand results in a prolonged negative effect on the potential growth trend via the weak investment channel.
OECD countries evidence, especially that of the Southern Europe, shows that countries that have previously experienced greater misallocations of capital in the period of unusually low interest rates have also suffered the most severe abruptions
103
| Appendix E | Bilaga 1 till LU2023 |
(declines) in capital growth (see Figure E.1). Finally, in an accounting sense, the fall in the capital deepening contribution to potential growth also comes from a trend rise in capital depreciation rates mainly associated with shortening lives of the
Government investment has also experienced a downturn in the aftermath of the crisis which may have had a spillover effect on the business investment and productivity as well. Existing literature finds that the link between public and private sector investment is strong and positive, particularly when market failures result in private
Figure E.1
Note: Excludes Iceland and Turkey.
Source: OECD (2016a).
In the decade following the wake of the crisis capital deepening prevailed as the main contributing factor to lower productivity
104
| Bilaga 1 till LU2023 | Appendix E |
growth. A 0.4 percentage point drop in the annual capital deepening can alone account for the slowdown in trend productivity growth in the
In many aspects Sweden has shared the experience of other advanced economies, most notably regarding the prolonged fall in capital per worker and TFP growth contributions to potential output growth where the latter development started already in the
The effects of economic crises, and negative events in general, have also large implications for the TFP growth. High uncertainty associated with periods of crises gives agents an incentive to postpone or cancel their investment and other business decisions until more information is revealed and uncertainty diminishes. This is hindering reallocation of resources and ultimately harms innovation incentives which are the drivers of TFP growth. (Bernanke, 1983).
Uncertainty and pressures in the financial system bring distortions in the credit system. In normal times, KBC investment may be expected to be countercyclical, but credit constraints in crises periods can be a factor working in the opposite direction. If firms depend on external financing, financing innovation through borrowing may be difficult to obtain given the drop in earnings (Aghion, Hemous and Kharroubi, 2014). Accordingly, Nanda and Nicholas (2014) find that the rates of filing patents in the U.S. dropped temporarily during the Great recession. In general, recessions of moderate intensity create aggregate TFP benefits through destruction of less productive firms (the “cleansing effect” of recessions), but severe credit constraints limit the scope for experimentation and distort the foundation of the creative destruction as the engine of growth.
105
| Appendix E | Bilaga 1 till LU2023 |
The
Figure E.2 The effect of epidemics on productivity and investment
Note: Bars show the estimated impacts of the four most severe biological epidemics (SARS
Source: Dieppe (2021).
Economic research has investigated the potential implications of the pandemic for the multi
106
| Bilaga 1 till LU2023 | Appendix E |
most results are inconclusive, some early studies applying different methods find no significant effects overall and in the long run (see Table E.2 below).
Table E.2 Studies on the pandemic effects on
| Method | Effect on MFP |
| Furceri and Mourougane | Local projections on past |
| (2012). | financial crises in OECD |
| countries. |
No significant effect in the long term.
| Oulton and |
Estimations looking at |
| (2013). | episodes of past banking |
| crisis in 61 countries. | |
| Furceri et al. (2021). | Local projections on episodes |
| of past crises. | |
| Bloom et al. (2022). | Firms’ responses to a |
| questionnaire. |
Persistent impact on the level: 0,8 percent (not significant).
No significant effect for recession on average. Persistent impact on the level: 3 percent after 5 years for deep crises.
Broadly unchanged, but fall by 1 percent when accounting for the deterioration in quality.
Source: OECD/APO (2022).
The European Central Bank (2022) discusses different “scenario forecasts” of the
107
| Appendix E | Bilaga 1 till LU2023 |
Figure E.3 Range of estimates on the
Potential output growth (left) and the loss in potential output level (right)
Note: the
Source: European Central Bank 2022.
While large shocks such as those discussed above cause grave economic distress and call for special policy measures, they often also present opportunities. The pandemic crises, for example, has incentivized certain technological transformations that may have significant positive productivity effects in some sectors. Distance work, adoption of a higher share of digital technologies in work practices in manufacturing, finance and education, and onshoring of production with greater capital intensity represent some of these productivity and welfare improving aspects. (Dieppe and Kose 2020).
108
Statens offentliga utredningar 2023
Kronologisk förteckning
1.Skärpta straff för flerfaldig brottslighet. Ju.
2.En inre marknad för digitala tjänster
–ansvarsfördelning mellan myndigheter. Fi.
3.Nya regler om nödlidande kreditavtal och inkassoverksamhet. Ju.
4.Posttjänst för hela slanten. Finansieringsmodeller för framtidens samhällsomfattande posttjänst. Fi.
5.Från delar till helhet. Tvångsvården som en del av en sammanhållen och personcentrerad vårdkedja. S.
6.En lag om tilläggsskatt för företag i stora koncerner. Fi.
7.På egna ben.
Utvecklad samverkan för individers etablering på arbetsmarknaden. A.
8.Arbetslivskriminalitet – arbetet
i Sverige, en bedömning av omfattningen, lärdomar från Danmark och Finland. A.
9.Ett statligt huvudmannaskap för personlig assistans.
Ökad likvärdighet, långsiktighet och kvalitet. S.
10.Tandvårdens stöd till våldsutsatta patienter. S.
11.Tillfälligt miljötillstånd för samhällsviktig verksamhet
–för ökad försörjningsberedskap. KN.
12.Förstärkt skydd för demokratin och domstolarnas oberoende. Ju.
13.Patientöversikter inom EES och Sverige. S.
14.Organisera för hållbar utveckling. KN.
15.Förnybart i tanken. Ett styrmedelsförslag för en stärkt bioekonomi. LI.
16.Staten och betalningarna. Del 1 och 2. Fi.
17.En tydligare bestämmelse om hets mot folkgrupp. Ju.
18.Värdet av vinden. Kompensation, incitament och planering för
en hållbar fortsatt utbyggnad av vindkraften. Del 1 och 2. KN.
19.Statlig forskningsfinansiering. Underlagsrapporter. U.
20.Förbud mot bottentrålning i marina skyddade områden. LI.
21.Informationsförsörjning på skolområdet. Skolverkets ansvar. U.
22.Datalagring och åtkomst till elektronisk information. Ju.
23.Ett modernare socialförsäkringsskydd för gravida. S.
24.Etablering för fler – jämställda möjligheter till integration. A.
25.Kunskapskrav för permanent uppehållstillstånd. Ju.
26.Översyn av entreprenörsansvaret. A.
27.Kamerabevakning för ett bättre djurskydd. LI.
28.Samhället mot skolattacker. U.
29.Varje rörelse räknas – hur skapar vi ett samhälle som främjar fysisk aktivitet? S.
30.Ett trygghetssystem för alla. Nytt regelverk för sjukpenninggrundande inkomst. S.
31.Framtidens yrkeshögskola
– stabil, effektiv och hållbar. U.
32.Biometri – för en effektivare brottsbekämpning. Ju.
33.Ett förbättrat resegarantisystem. Fi.
34.Bolag och brott – några åtgärder mot oseriösa företag. Ju.
35.Nya regler om hållbarhetsredovisning. Ju.
36.Genomförande av minimilönedirektivet. A.
37.Förstärkt skydd för den personliga integriteten. Behovet av åtgärder mot oskuldskontroller, oskuldsintyg och oskuldsingrepp samt omvändelseförsök. Ju.
38.Ett förstärkt konsumentskydd mot riskfylld kreditgivning och överskuldsättning. Fi.
39.En inre marknad för digitala tjänster
–kompletteringar och ändringar i svensk rätt. Fi.
40.Förbättrade möjligheter för barn att utkräva sina rättigheter enligt barnkonventionen. S.
41.Förutsättningarna för en ny kollektivavtalad arbetslöshetsförsäkring. A.
42.Ett modernare regelverk för legaliseringar, apostille och andra former av intyganden. UD.
43.En samordnad registerkontroll för upphandlande myndigheter och enheter. Fi.
44.En översyn av regleringen om frihetsberövande påföljder för unga. Ju.
45.Övergångsrestriktioner
–ökat förtroende för offentlig verksamhet. Fi.
46.Jakt och fiske i renbetesland. LI.
47.En utvecklad arbetsgivardeklaration
–åtgärder mot missbruk av välfärdssystemen. Fi.
48.Rätt förutsättningar för sjukskrivning. S.
49.Skyddet för EU:s finansiella intressen. Ändringar och kompletteringar i svensk rätt. Fi.
50.En modell för svensk försörjningsberedskap. Fö.
51.Signalspaning i försvarsunderrättelseverksamhet
–frågor med anledning
av Europadomstolens dom. Fö.
52.Ett stärkt och samlat skydd av välfärdssystemen. S.
53.En ändamålsenlig arbetsskadeförsäkring – för bättre ekonomisk trygghet, kunskap och rättssäkerhet. Volym 1 och 2. S.
54.Centraliseringen av administrativa tjänster till Statens servicecenter
–en utvärdering. Fi.
55.Vem äger fastigheten. Ju.
56.Några smittskyddsfrågor inom socialtjänsten och socialförsäkringen. S.
57.Åtgärder för tryggare bostadsområden. Ju.
58.Kultursamhället – utvecklad samverkan mellan stat, region och kommun. Ku.
59.Ny myndighetsstruktur för finansiering av forskning och innovation. U.
60.Utökade möjligheter att använda preventiva tvångsmedel 2. Ju.
61.En säker och tillgänglig statlig
62.Vi kan bättre!
Kunskapsbaserad narkotikapolitik med liv och hälsa i fokus. S.
63.Sveriges säkerhet i etern. Ku.
64.Ett förändrat regelverk för framtidens el- och gasnät. KN.
65.Bättre information om hyresbostäder. Kartläggning av andrahandsmarknaden och ett förbättrat lägenhetsregister. LI.
66.För barn och unga i samhällsvård. S.
67.Anonyma vittnen. Ju.
68.Som om vi aldrig funnits
–exkludering och assimilering av
tornedalingar,kväner och lantalaiset. Aivan ko meitä ei olis ollukhaan
–eksklyteerinki ja assimileerinki tornionlaaksolaisista, kväänistä ja lantalaisista. Slutbetänkande.
Som om vi aldrig funnits. Vår sanning och verklighet. Aivan ko meitä ei olis ollukhaan. Meän tottuus ja toelisuus. Intervjuberättelser.
Som om vi aldrig funnits.
Tolv tematiska forskarrapporter. Aivan ko meitä ei olis ollukhaan. Kakstoista temattista tutkintoraporttia. Forskarrapporter. Ku.
69.Ökat informationsflöde till brottsbekämpningen. En ny huvudregel. Ju.
70.Ordning och reda – förstärkt och tillförlitlig byggkontroll. LI.
71.Speciallivsmedel till barn inom öppen hälso- och sjukvård. S.
72.En enklare hantering av vattenfrågor vid planläggning och byggande. LI.
73.Genomförandet av vaccineringen mot sjukdomen
74.Förenklade förutsättningar för ett hållbart vattenbruk. LI.
75.Stärkt konstitutionell beredskap. Ju.
76.Vidareanvändning av hälsodata för vård och klinisk forskning. S.
77.Behörig myndighet enligt EU:s avskogningsförordning. LI.
78.Hemlig dataavläsning – utvärdering och permanent lagstiftning. Ju.
79.Arbetsrätten under krig och krigsfara. A.
80.Ett starkare straffrättsligt skydd– mot sexuella kränkningar, bedrägerier
ivissa fall och brott med hatmotiv avseende kön. Ju.
81.Ett enklare bilstöd. S.
82.Ökad kontroll över tandvårdssektorn. S.
83.Samordnat juridiskt stöd och vägledning för hälso-
och sjukvårdens digitalisering. S.
84.En hållbar bioekonomistrategi
– för ett välmående fossilfritt samhälle. LI.
85.Långtidsutredningen 2023. Finans politisk konjunkturstabilisering. Huvudbetänkande. Fi.
86.Trends in GDP Growth and its Driving Factors. Bilaga 1 till Långtids utredningen 2023. Fi.
87.Drivkrafter bakom globala trender
iden neutrala räntan. Bilaga 2 till Långtidsutredningen 2023. Fi.
88.
89.Makrotillsynsregleringar och finansiell stabilitet. Bilaga 4 till Långtids utredningen 2023. Fi.
90.Samspelet mellan finans- och penningpolitik i Sverige. Bilaga 5 till Långtidsutredningen 2023. Fi.
91.Penning- och finanspolitisk konjunkturstabilisering. Bilaga 6 till Långtidsutredningen 2023. Fi.
92.Nytt ramverk för finanspolitiken. Bilaga 7 till Långtidsutredningen 2023. Fi.
93.Budgetprocessen i det finanspolitiska ramverket. Bilaga 8 till Långtids utredningen 2023. Fi.
Statens offentliga utredningar 2023
Systematisk förteckning
Arbetsmarknadsdepartementet
På egna ben.
Utvecklad samverkan för individers etablering på arbetsmarknaden. [7]
Arbetslivskriminalitet – arbetet i Sverige, en bedömning av omfattningen, lärdomar från Danmark och Finland. [8]
Etablering för fler – jämställda möjligheter till integration. [24]
Översyn av entreprenörsansvaret. [26]
Genomförande av minimilönedirektivet. [36]
Förutsättningarna för en ny kollektiv avtalad arbetslöshetsförsäkring. [41]
Arbetsrätten under krig och krigsfara. [79]
Finansdepartementet
En inre marknad för digitala tjänster
–ansvarsfördelning mellan myndigheter. [2]
Posttjänst för hela slanten. Finansieringsmodeller för framtidens samhällsomfattande posttjänst. [4]
En lag om tilläggsskatt för företag i stora koncerner. [6]
Staten och betalningarna. Del 1 och 2. [16] Ett förbättrat resegarantisystem. [33]
Ett förstärkt konsumentskydd mot riskfylld kreditgivning och överskuldsättning. [38]
En inre marknad för digitala tjänster - kompletteringar och ändringar
i svensk rätt. [39]
En samordnad registerkontroll för upphandlande myndigheter och enheter. [43]
Övergångsrestriktioner – ökat förtroende för offentlig verksamhet. [45]
En utvecklad arbetsgivardeklaration
–åtgärder mot missbruk av välfärdssystemen. [47]
Skyddet för EU:s finansiella intressen. Ändringar och kompletteringar
i svensk rätt. [49]
Centraliseringen av administrativa tjänster till Statens servicecenter
– en utvärdering. [54]
En säker och tillgänglig statlig
Långtidsutredningen 2023. Finanspolitisk konjunkturstabilisering. Huvudbetänkande. [85]
Trends in GDP Growth and its Driving Factors. Bilaga 1 till Långtids utredningen 2023. [86]
Drivkrafter bakom globala trender i den neutrala räntan. Bilaga 2 till Långtids utredningen 2023. [87]
Makrotillsynsregleringar och finansiell stabilitet. Bilaga 4 till Långtids utredningen 2023. [89]
Samspelet mellan finans- och penning politik i Sverige. Bilaga 5 till Långtids utredningen 2023. [90]
Penning- och finanspolitisk konjunktur stabilisering. Bilaga 6 till Långtids utredningen 2023. [91]
Nytt ramverk för finanspolitiken. Bilaga 7 till Långtidsutredningen 2023. [92]
Budgetprocessen i det finanspolitiska ramverket. Bilaga 8 till Långtids utredningen 2023. [93]
Försvarsdepartementet
En modell för svensk försörjningsberedskap. [50]
Signalspaning i försvarsunderrättelseverksamhet
– frågor med anledning
av Europadomstolens dom. [51]
Justitiedepartementet
Skärpta straff för flerfaldig brottslighet. [1]
Nya regler om nödlidande kreditavtal och inkassoverksamhet. [3]
Förstärkt skydd för demokratin och domstolarnas oberoende. [12]
En tydligare bestämmelse om hets mot folkgrupp. [17]
Datalagring och åtkomst till elektronisk information. [22]
Kunskapskrav för permanent uppehållstillstånd. [25]
Biometri – för en effektivare brottsbekämpning. [32]
Bolag och brott – några åtgärder mot oseriösa företag. [34]
Nya regler om hållbarhetsredovisning. [35]
Förstärkt skydd för den personliga integriteten. Behovet av åtgärder mot oskuldskontroller, oskuldsintyg och oskuldsingrepp samt omvändelseförsök. [37]
En översyn av regleringen om frihetsberövande påföljder för unga. [44]
Vem äger fastigheten. [55]
Åtgärder för tryggare bostadsområden. [57]
Utökade möjligheter att använda preventiva tvångsmedel 2. [60]
Anonyma vittnen. [67]
Ökat informationsflöde till brottsbekämpningen. En ny huvudregel. [69]
Stärkt konstitutionell beredskap. [75]
Hemlig dataavläsning – utvärdering och permanent lagstiftning. [78]
Ett starkare straffrättsligt skydd– mot sexuella kränkningar, bedrägerier i vissa fall och brott med hatmotiv avseende kön. [80]
Klimat- och näringslivsdepartementet
Tillfälligt miljötillstånd för samhällsviktig verksamhet
–för ökad försörjningsberedskap. [11] Organisera för hållbar utveckling. [14]
Värdet av vinden. Kompensation, incitament och planering för en hållbar fortsatt utbyggnad av vindkraften. Del 1 och 2. [18]
Ett förändrat regelverk för framtidens el- och gasnät. [64]
Kulturdepartementet
Kultursamhället – utvecklad samverkan mellan stat, region och kommun. [58]
Sveriges säkerhet i etern. [63] Som om vi aldrig funnits
–exkludering och assimilering av
tornedalingar,kväner och lantalaiset. Aivan ko meitä ei olis ollukhaan
–eksklyteerinki ja assimileerinki tornionlaaksolaisista, kväänistä ja lantalaisista. Slutbetänkande.
Som om vi aldrig funnits. Vår sanning och verklighet. Aivan ko meitä ei olis ollukhaan. Meän tottuus ja toelisuus.
Intervjuberättelser.
Som om vi aldrig funnits.
Tolv tematiska forskarrapporter. Aivan ko meitä ei olis ollukhaan.
Kakstoista temattista tutkintoraporttia. Forskarrapporter. [68]
Landsbygds- och infrastrukturdepartementet
Förnybart i tanken. Ett styrmedelsförslag för en stärkt bioekonomi. [15]
Förbud mot bottentrålning i marina skyddade områden. [20]
Kamerabevakning för ett bättre djurskydd. [27]
Jakt och fiske i renbetesland. [46]
Bättre information om hyresbostäder. Kartläggning av andrahandsmarknaden och ett förbättrat lägenhetsregister. [65]
Ordning och reda – förstärkt och tillförlitlig byggkontroll. [70]
En enklare hantering av vattenfrågor vid planläggning och byggande. [72]
Förenklade förutsättningar
för ett hållbart vattenbruk. [74]
Behörig myndighet enligt EU:s avskogningsförordning. [77]
En hållbar bioekonomistrategi.
–för ett välmående fossilfritt samhälle. [84]
Socialdepartementet
Från delar till helhet. Tvångsvården som en del av en sammanhållen och personcentrerad vårdkedja. [5]
Ett statligt huvudmannaskap för personlig assistans.
Ökad likvärdighet, långsiktighet och kvalitet. [9]
Tandvårdens stöd till våldsutsatta patienter. [10]
Patientöversikter inom EES och Sverige. [13]
Ett modernare socialförsäkringsskydd för gravida. [23]
Varje rörelse räknas – hur skapar vi ett samhälle som främjar fysisk aktivitet? [29]
Ett trygghetssystem för alla. Nytt regelverk för sjukpenninggrundande inkomst. [30]
Förbättrade möjligheter för barn att
utkräva sina rättigheter enligt barnkonventionen. [40]
Rätt förutsättningar för sjukskrivning. [48]
Ett stärkt och samlat skydd av välfärdssystemen. [52]
En ändamålsenlig arbetsskadeförsäkring
–för bättre ekonomisk trygghet, kunskap och rättssäkerhet. Volym 1 och 2. [53]
Några smittskyddsfrågor inom social tjänsten och socialförsäkringen. [56]
Vi kan bättre!
Kunskapsbaserad narkotikapolitik med liv och hälsa i fokus. [62]
För barn och unga i samhällsvård. [66]
Speciallivsmedel till barn inom öppen hälso- och sjukvård. [71]
Genomförandet av vaccineringen mot sjukdomen
Vidareanvändning av hälsodata för vård och klinisk forskning. [76]
Ett enklare bilstöd. [81]
Ökad kontroll över tandvårdssektorn. [82]
Samordnat juridiskt stöd och vägledning för hälso-
och sjukvårdens digitalisering. [83]
Utbildningsdepartementet
Statlig forskningsfinansiering. Underlagsrapporter. [19]
Informationsförsörjning på skolområdet. Skolverkets ansvar. [21]
Samhället mot skolattacker. [28]
Framtidens yrkeshögskola
– stabil, effektiv och hållbar. [31]
Ny myndighetsstruktur för finansiering av forskning och innovation. [59]
Utrikesdepartementet
Ett modernare regelverk för legaliseringar, apostille och andra former av intyganden. [42]